25+ “How to Sell on Amazon” Courses, Mentorships, and Trainings
Scott Needham
CEO and Founder of SmartScout
The biggest brands on Amazon are a live lesson in what sells and why. Some win on premium electronics, others on private-label volume or a single breakout category.
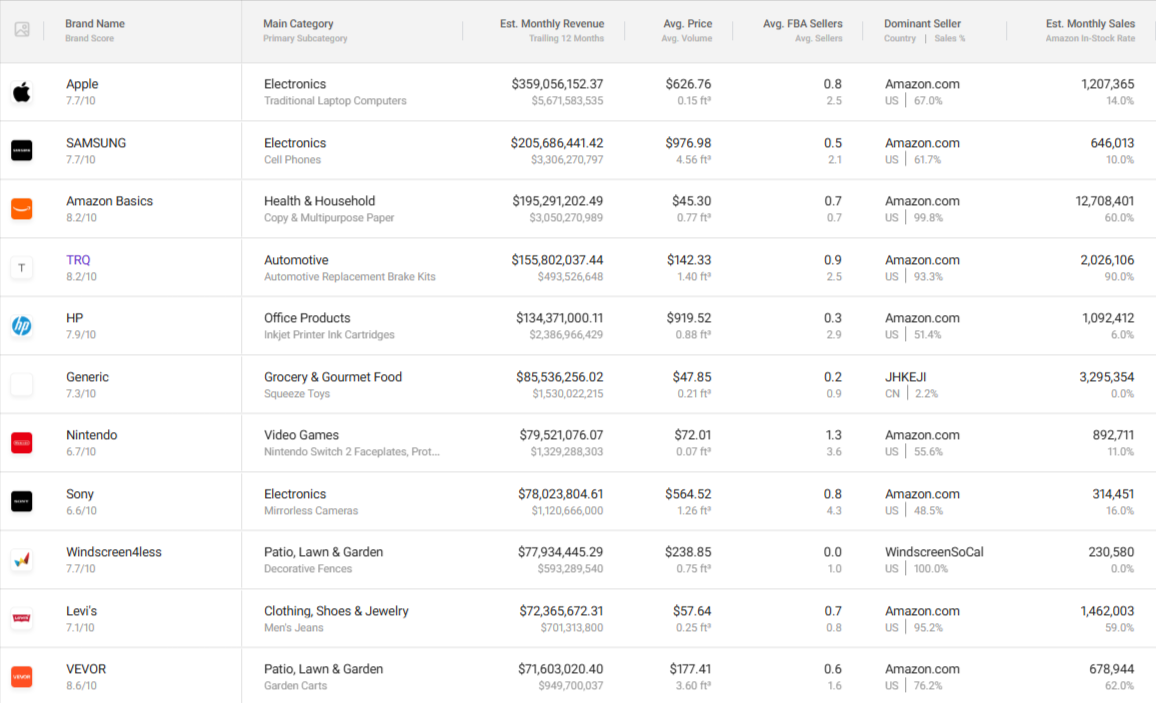
Using current data from SmartScout's Brands tool, this guide ranks the ten largest brands on the U.S. marketplace by monthly revenue, then breaks down each one: what it sells, how much it earns, who actually controls its listings, and how fast it is growing. Whether you sell on Amazon or just study it, the patterns are worth knowing.
How We Ranked the Largest Amazon Brands?
Every figure here comes from SmartScout's Brands tool and reflects the U.S. market. Brands are ranked by estimated monthly revenue, the sum of estimated 30-day sales across all of a brand's products.
Alongside revenue, we include the trailing twelve-month total, the average price, the dominant seller, and SmartScout's Brand Score, a composite grade from 0 to 10 that weighs sales, reviews, and catalog health. Revenue shifts constantly, so treat this as a snapshot rather than a fixed leaderboard.
One exclusion is worth noting: we leave out Amazon's "Generic" label, which is not a brand but a catch-all tag for unbranded products, so the ten below are all real, identifiable brands.
The 10 Largest Amazon Brands by Revenue in 2026
Before we start, here is the list of the top 10 brands we are going to discuss:
Apple
Samsung
Amazon Basics
TRQ
HP
Nintendo
Sony
Windscreen4less
Levi’s
VEVOR
These ten brands lead the U.S. marketplace by estimated monthly revenue. Notice how differently they get there, from a few high-priced electronics to millions of low-cost everyday units.
1. Apple
Metric
Details
Est. monthly revenue
$359.1M (TTM $5.67B)
Top category
Electronics, led by laptops and renewed devices
Average price
$626.76
Dominant seller
Amazon.com (US, 67.0%)
Brand Score
7.7 / 10
Avg. rating
4.33 (6.5M reviews)
12-month growth
+5.7%
Apple tops Amazon's brand rankings by a wide margin at an estimated $359 million a month. Laptops lead its revenue, with renewed iPhones, iPads, and accessories filling out a 13,600-product catalog.
Amazon itself is the seller on 67% of those sales, so most of Apple's volume runs through a first-party vendor relationship while resellers handle the rest. The 5.7% yearly growth looks modest, but on a base this size, it represents enormous absolute gains.
2. Samsung
Metric
Details
Est. monthly revenue
$205.7M (TTM $3.31B)
Top category
Electronics, led by cell phones
Average price
$976.98 (highest on the list)
Dominant seller
Amazon.com (US, 61.7%)
Brand Score
7.7 / 10
Avg. rating
4.21 (4.5M reviews)
12-month growth
+39.6%
Samsung is the clearest high-ticket play here, with the steepest average price of any brand at roughly $977, driven by cell phones. Amazon is again the dominant seller at 61.7%.
The brand grew almost 40% over the year, even though it slipped 11.4% in the latest month, a useful reminder that monthly noise and the yearly trend often disagree. Its 4.5 million reviews give it the kind of social proof newer brands spend years trying to build.
3. Amazon Basics
Metric
Details
Est. monthly revenue
$195.3M (TTM $3.05B)
Top category
Health & Household, led by paper and essentials
Average price
$45.30
Dominant seller
Amazon.com (US, 99.8%, Amazon’s own private label)
Brand Score
8.2 / 10
Avg. rating
4.49 (25.9M reviews)
12-month growth
+29.7%
Amazon Basics is Amazon's own private label, and the data makes that obvious: Amazon is the seller on 99.8% of its sales, an almost pure first-party operation. It wins on the opposite strategy to Apple, low prices around $45 and staggering volume, moving an estimated 12.7 million units a month across everyday essentials.
It is worth saying plainly that this is Amazon competing as a brand on its own platform, against the very sellers who list there. Its 25.9 million reviews are the second-largest review base in this group.
4. TRQ
Metric
Details
Est. monthly revenue
$155.8M (TTM $493.5M)
Top category
Automotive, led by replacement brake kits
Average price
$142.33
Dominant seller
Amazon.com (US, 93.3%)
Brand Score
8.2 / 10
Avg. rating
4.33 (610K reviews)
12-month growth
+2.3% and +262.5% in the latest month
TRQ, an aftermarket auto-parts brand, is the breakout story of this ranking. Its revenue jumped an extraordinary 262.5% in a single month, led by replacement brake kits, and it carries one of the largest catalogs here at nearly 59,000 products.
Amazon is the dominant seller at 93.3%, and a Brand Score of 8.2 reflects strong, consistent performance. The gap between its $156 million monthly figure and its $494 million trailing-year total shows how recent and sharp that surge has been.
5. HP
Metric
Details
Est. monthly revenue
$134.4M (TTM $2.39B)
Top category
Office Products, led by inkjet ink cartridges
Average price
$919.52
Dominant seller
Amazon.com (US, 51.4%)
Brand Score
7.9 / 10
Avg. rating
4.30 (2.6M reviews)
12-month growth
+17.9%
HP's revenue spans laptops, printers, and especially ink cartridges, its single biggest subcategory. It is the most fragmented major brand here when it comes to who sells it: Amazon is dominant on only 51.4% of sales, with independent resellers, many of them moving ink, accounting for nearly half.
That split is typical of consumable accessories, where third-party sellers compete aggressively. Steady 17.9% yearly growth keeps HP firmly in the top five.
6. Nintendo
Metric
Details
Est. monthly revenue
$79.5M (TTM $1.33B)
Top category
Video Games, led by Switch 2 accessories
Average price
$72.01
Dominant seller
Amazon.com (US, 55.6%)
Brand Score
6.7 / 10
Avg. rating
4.31 (4.8M reviews)
12-month growth
+187.4%
Nintendo's numbers are riding the launch of the Switch 2, and the growth proves it: revenue is up a remarkable 187% over twelve months, with Switch 2 faceplates and protectors as the top subcategory.
Amazon is the dominant seller at 55.6%, and an affordable average price near $72 reflects a catalog heavy on games and accessories rather than just hardware. It is the best example here of a single product cycle reshaping a brand's entire trajectory.
7. Sony
Metric
Details
Est. monthly revenue
$78.0M (TTM $1.12B)
Top category
Electronics, led by mirrorless cameras
Average price
$564.52
Dominant seller
Amazon.com (US, 48.5%)
Brand Score
6.6 / 10
Avg. rating
4.41 (3.7M reviews)
12-month growth
+15.3%
Sony spans cameras, audio, and electronics, with mirrorless cameras leading its revenue. Like HP, it has a fragmented seller base: Amazon is dominant on under half of its sales at 48.5%, leaving plenty of room for authorized resellers.
A 4.41 average rating across 3.7 million reviews speaks to consistent product quality, even if its 6.6 Brand Score sits toward the lower end of this group.
8. Windscreen4less
Metric
Details
Est. monthly revenue
$77.9M (TTM $593.3M)
Top category
Patio, Lawn & Garden, led by decorative fences
Average price
$238.85
Dominant seller
WindscreenSoCal (US, 100%, single seller)
Brand Score
7.7 / 10
Avg. rating
4.42 (434K reviews)
12-month growth
+33.1%
Windscreen4less is the list's private-label outlier, and it links straight to the seller rankings: it is sold 100% by a single storefront, WindscreenSoCal, one of the largest sellers on Amazon.
The brand specializes in bulky outdoor goods like fences and privacy windscreens at a healthy $239 average price. Because one company owns both the brand and its fulfillment, it controls pricing and margin end to end, and it has grown 33% over the year.
9. Levi's
Metric
Details
Est. monthly revenue
$72.4M (TTM $701.3M)
Top category
Clothing, Shoes & Jewelry, led by men’s jeans
Average price
$57.64
Dominant seller
Amazon.com (US, 95.2%)
Brand Score
7.1 / 10
Avg. rating
4.43 (43.4M reviews, the most on this list)
12-month growth
+50.8%
Levi's brings iconic-brand heritage to the ranking, led by men's jeans at an accessible $58 average price. Amazon is the seller on 95.2% of its sales, a near-pure first-party vendor relationship. What stands out most is trust: with 43.4 million reviews,
Levi's has the largest review base of any brand here by a distance, and it paired that with 50.8% yearly growth. Heritage plus volume is a powerful combination.
10. VEVOR
Metric
Details
Est. monthly revenue
$71.6M (TTM $949.7M)
Top category
Patio, Lawn & Garden, led by garden carts
Average price
$177.41
Dominant seller
Amazon.com (US, 76.2%)
Brand Score
8.6 / 10 (highest on the list)
Avg. rating
4.23 (790K reviews)
12-month growth
+42.3%
VEVOR rounds out the top 10 and carries the highest Brand Score of any brand here at 8.6, ahead of even Apple and Amazon Basics. The China-based equipment and tools brand sells everything from garden carts to workshop gear at a mid-range $177 average price, with Amazon as the dominant seller on 76.2% of sales.
Paired with 42.3% yearly growth, that combination of a top score and fast momentum makes VEVOR one of the brands most likely to climb this list in the coming year.
*TTM stands for Trailing Twelve Months. It's the total revenue over the most recent 12 months, counting backward from today rather than following the calendar year.
What Is an Amazon Vendor Brand?
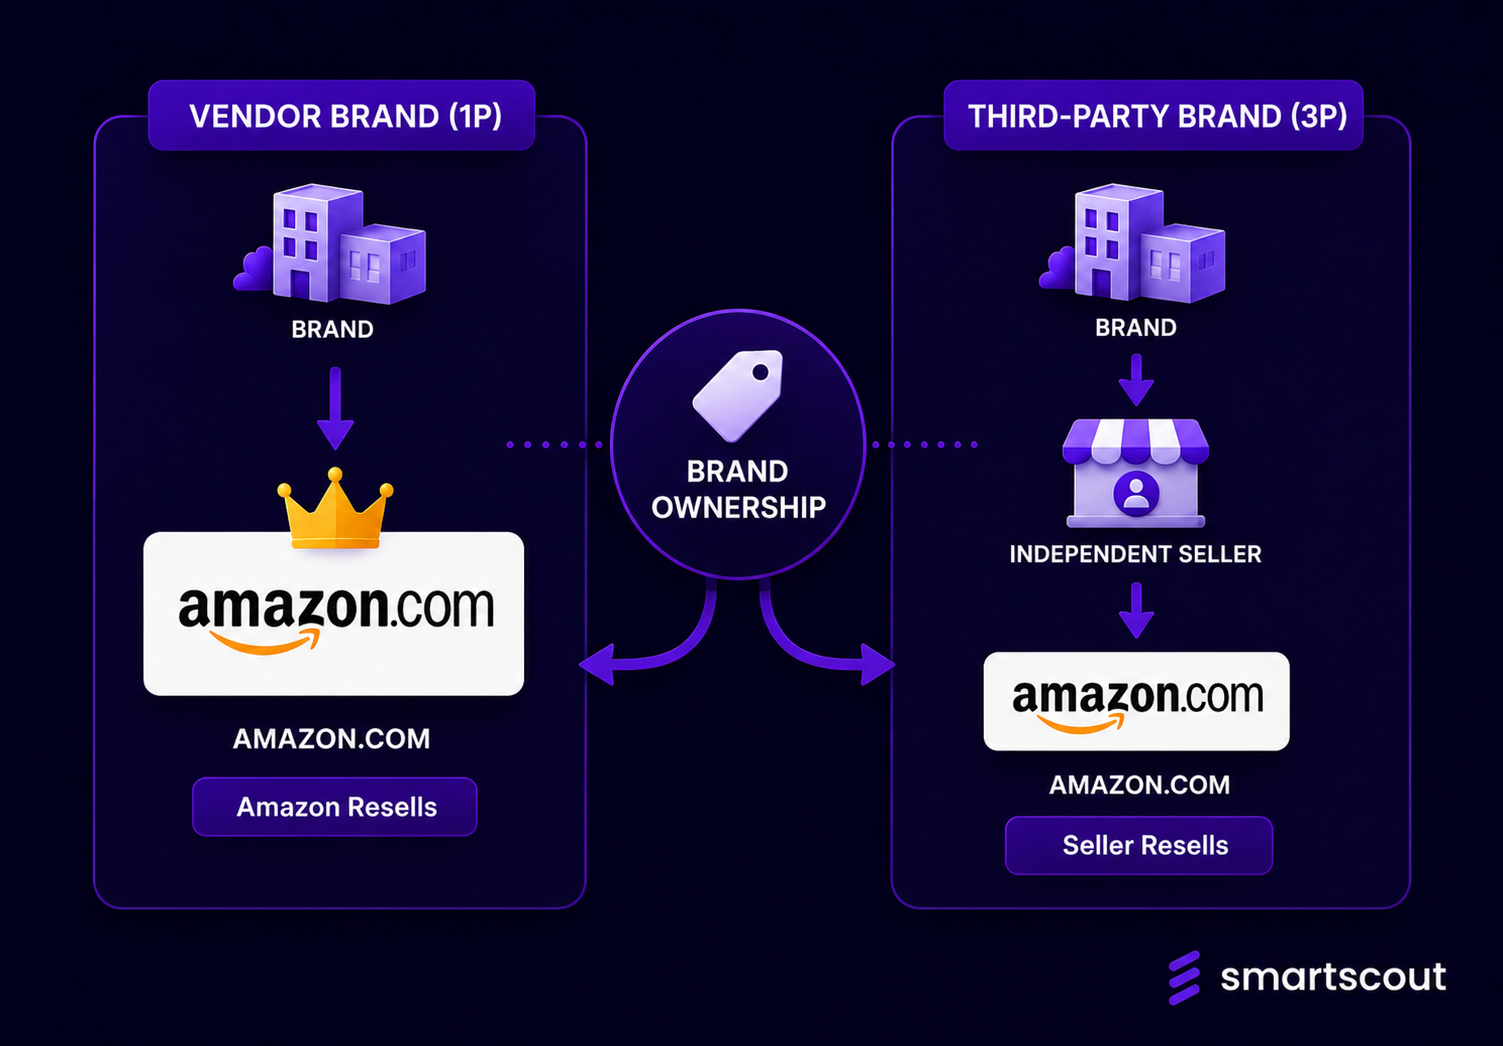
On Amazon, a vendor brand is one that sells its products wholesale to Amazon through Vendor Central, and Amazon then resells them as a first-party (1P) retailer. You can spot this in the data through the "dominant seller" figure: when Amazon.com is the seller behind most of a brand's sales, that brand is operating largely as a 1P vendor.
When an independent seller is dominant instead, the brand is sold third-party (3P), often by its own owner or a network of resellers. Most of the biggest names below are vendor brands, but not all, and that distinction explains a lot about how each one operates. If you want the broader picture, SmartScout's 1P vs 3P report breaks down the split across the whole marketplace.
What the Data Says About Amazon's Biggest Brands?
Line these brands up side by side, and a few patterns explain how a brand reaches the top of Amazon.
1. Electronics and High Prices Still Rule
Apple, Samsung, HP, and Sony are all electronics brands, and most of the list carries average prices above $100, topping out at Samsung's $977. A high average price means a brand needs far fewer units to post big revenue. The exceptions, Amazon Basics, Nintendo, and Levi's, prove the other route: win on sheer volume at lower prices instead.
2. Most of These Are Sold by Amazon Itself
For the majority of this list, Amazon.com is the dominant seller, including Apple at 67%, Amazon Basics at 99.8%, TRQ at 93.3%, Levi's at 95.2%, and VEVOR at 76.2%. That is the signature of a first-party vendor brand: the company sells wholesale to Amazon, and Amazon resells. The clearest exception is Windscreen4less, sold entirely by a single third-party seller, with HP and Sony sitting in between at roughly half their sales running through Amazon and half through independent resellers.
3. A Perfect Brand Score Is Not Required
VEVOR leads on Brand Score at 8.6, with Amazon Basics and TRQ close behind at 8.2, yet the two biggest brands by revenue, Apple and Samsung, sit at 7.7, and Sony cracks the top eight at just 6.6. Revenue and Brand Score measure different things. A strong multinational brand can dominate sales without a flawless score, which is good news for any seller worried about hitting a perfect grade.
4. Growth Is Where the Real Story Lives
Size tells you where a brand is today, but growth tells you where it is headed, and the two often diverge. TRQ surged 262% in a single month, Nintendo is up 187% over the year on the Switch 2 launch, and Levi's, VEVOR, and Samsung all grew 40% or more, while the biggest name of all, Apple, inched up just 5.7%. The fastest risers are rarely the biggest brands, which is exactly where opportunity tends to hide.
How to Find Growing Amazon Brands With SmartScout
Every number in this article came from one place, and you can run the same analysis on any category in minutes. Here is the workflow behind the ranking above.
Sort the field. Open the Brands database and filter by estimated revenue, growth rate, or Brand Score to surface both the leaders and the fast risers in any niche.
Find the gaps. Use the Subcategories browser to spot categories where demand is high but no single brand has taken control, the openings where a new entrant can realistically compete.
Check who controls the sales. Review the dominant seller and 1P versus 3P split with Seller Tools to judge whether a brand is wholesale-friendly or locked down by its owner.
Pressure-test the margin. Before sourcing anything, run it through the FBA Calculator so you know your real net after fees.
The Bottom Line: Apple is currently the largest vendor brand on Amazon
Amazon's largest brands do not share a category, a price point, or even a business model. Apple wins on premium electronics, Amazon Basics on private-label volume, TRQ and Nintendo on explosive growth, and Windscreen4less on owning its niche end to end.
What unites them is scale built on a clear strategy, whether that is a first-party vendor relationship, a private label, or a heritage name with millions of reviews. The brands worth watching, though, are the ones growing fastest, and the same data that surfaced this list will surface them in any category you choose to study.
The biggest brands on Amazon are a live lesson in what sells and why. Some win on premium electronics, others on private-label volume or a single breakout category.
Using current data from SmartScout's Brands tool, this guide ranks the ten largest brands on the U.S. marketplace by monthly revenue, then breaks down each one: what it sells, how much it earns, who actually controls its listings, and how fast it is growing. Whether you sell on Amazon or just study it, the patterns are worth knowing.
How We Ranked the Largest Amazon Brands?
Every figure here comes from SmartScout's Brands tool and reflects the U.S. market. Brands are ranked by estimated monthly revenue, the sum of estimated 30-day sales across all of a brand's products.
Alongside revenue, we include the trailing twelve-month total, the average price, the dominant seller, and SmartScout's Brand Score, a composite grade from 0 to 10 that weighs sales, reviews, and catalog health. Revenue shifts constantly, so treat this as a snapshot rather than a fixed leaderboard.
One exclusion is worth noting: we leave out Amazon's "Generic" label, which is not a brand but a catch-all tag for unbranded products, so the ten below are all real, identifiable brands.
The 10 Largest Amazon Brands by Revenue in 2026
Before we start, here is the list of the top 10 brands we are going to discuss:
Apple
Samsung
Amazon Basics
TRQ
HP
Nintendo
Sony
Windscreen4less
Levi’s
VEVOR
These ten brands lead the U.S. marketplace by estimated monthly revenue. Notice how differently they get there, from a few high-priced electronics to millions of low-cost everyday units.
1. Apple
Metric
Details
Est. monthly revenue
$359.1M (TTM $5.67B)
Top category
Electronics, led by laptops and renewed devices
Average price
$626.76
Dominant seller
Amazon.com (US, 67.0%)
Brand Score
7.7 / 10
Avg. rating
4.33 (6.5M reviews)
12-month growth
+5.7%
Apple tops Amazon's brand rankings by a wide margin at an estimated $359 million a month. Laptops lead its revenue, with renewed iPhones, iPads, and accessories filling out a 13,600-product catalog.
Amazon itself is the seller on 67% of those sales, so most of Apple's volume runs through a first-party vendor relationship while resellers handle the rest. The 5.7% yearly growth looks modest, but on a base this size, it represents enormous absolute gains.
2. Samsung
Metric
Details
Est. monthly revenue
$205.7M (TTM $3.31B)
Top category
Electronics, led by cell phones
Average price
$976.98 (highest on the list)
Dominant seller
Amazon.com (US, 61.7%)
Brand Score
7.7 / 10
Avg. rating
4.21 (4.5M reviews)
12-month growth
+39.6%
Samsung is the clearest high-ticket play here, with the steepest average price of any brand at roughly $977, driven by cell phones. Amazon is again the dominant seller at 61.7%.
The brand grew almost 40% over the year, even though it slipped 11.4% in the latest month, a useful reminder that monthly noise and the yearly trend often disagree. Its 4.5 million reviews give it the kind of social proof newer brands spend years trying to build.
3. Amazon Basics
Metric
Details
Est. monthly revenue
$195.3M (TTM $3.05B)
Top category
Health & Household, led by paper and essentials
Average price
$45.30
Dominant seller
Amazon.com (US, 99.8%, Amazon’s own private label)
Brand Score
8.2 / 10
Avg. rating
4.49 (25.9M reviews)
12-month growth
+29.7%
Amazon Basics is Amazon's own private label, and the data makes that obvious: Amazon is the seller on 99.8% of its sales, an almost pure first-party operation. It wins on the opposite strategy to Apple, low prices around $45 and staggering volume, moving an estimated 12.7 million units a month across everyday essentials.
It is worth saying plainly that this is Amazon competing as a brand on its own platform, against the very sellers who list there. Its 25.9 million reviews are the second-largest review base in this group.
4. TRQ
Metric
Details
Est. monthly revenue
$155.8M (TTM $493.5M)
Top category
Automotive, led by replacement brake kits
Average price
$142.33
Dominant seller
Amazon.com (US, 93.3%)
Brand Score
8.2 / 10
Avg. rating
4.33 (610K reviews)
12-month growth
+2.3% and +262.5% in the latest month
TRQ, an aftermarket auto-parts brand, is the breakout story of this ranking. Its revenue jumped an extraordinary 262.5% in a single month, led by replacement brake kits, and it carries one of the largest catalogs here at nearly 59,000 products.
Amazon is the dominant seller at 93.3%, and a Brand Score of 8.2 reflects strong, consistent performance. The gap between its $156 million monthly figure and its $494 million trailing-year total shows how recent and sharp that surge has been.
5. HP
Metric
Details
Est. monthly revenue
$134.4M (TTM $2.39B)
Top category
Office Products, led by inkjet ink cartridges
Average price
$919.52
Dominant seller
Amazon.com (US, 51.4%)
Brand Score
7.9 / 10
Avg. rating
4.30 (2.6M reviews)
12-month growth
+17.9%
HP's revenue spans laptops, printers, and especially ink cartridges, its single biggest subcategory. It is the most fragmented major brand here when it comes to who sells it: Amazon is dominant on only 51.4% of sales, with independent resellers, many of them moving ink, accounting for nearly half.
That split is typical of consumable accessories, where third-party sellers compete aggressively. Steady 17.9% yearly growth keeps HP firmly in the top five.
6. Nintendo
Metric
Details
Est. monthly revenue
$79.5M (TTM $1.33B)
Top category
Video Games, led by Switch 2 accessories
Average price
$72.01
Dominant seller
Amazon.com (US, 55.6%)
Brand Score
6.7 / 10
Avg. rating
4.31 (4.8M reviews)
12-month growth
+187.4%
Nintendo's numbers are riding the launch of the Switch 2, and the growth proves it: revenue is up a remarkable 187% over twelve months, with Switch 2 faceplates and protectors as the top subcategory.
Amazon is the dominant seller at 55.6%, and an affordable average price near $72 reflects a catalog heavy on games and accessories rather than just hardware. It is the best example here of a single product cycle reshaping a brand's entire trajectory.
7. Sony
Metric
Details
Est. monthly revenue
$78.0M (TTM $1.12B)
Top category
Electronics, led by mirrorless cameras
Average price
$564.52
Dominant seller
Amazon.com (US, 48.5%)
Brand Score
6.6 / 10
Avg. rating
4.41 (3.7M reviews)
12-month growth
+15.3%
Sony spans cameras, audio, and electronics, with mirrorless cameras leading its revenue. Like HP, it has a fragmented seller base: Amazon is dominant on under half of its sales at 48.5%, leaving plenty of room for authorized resellers.
A 4.41 average rating across 3.7 million reviews speaks to consistent product quality, even if its 6.6 Brand Score sits toward the lower end of this group.
8. Windscreen4less
Metric
Details
Est. monthly revenue
$77.9M (TTM $593.3M)
Top category
Patio, Lawn & Garden, led by decorative fences
Average price
$238.85
Dominant seller
WindscreenSoCal (US, 100%, single seller)
Brand Score
7.7 / 10
Avg. rating
4.42 (434K reviews)
12-month growth
+33.1%
Windscreen4less is the list's private-label outlier, and it links straight to the seller rankings: it is sold 100% by a single storefront, WindscreenSoCal, one of the largest sellers on Amazon.
The brand specializes in bulky outdoor goods like fences and privacy windscreens at a healthy $239 average price. Because one company owns both the brand and its fulfillment, it controls pricing and margin end to end, and it has grown 33% over the year.
9. Levi's
Metric
Details
Est. monthly revenue
$72.4M (TTM $701.3M)
Top category
Clothing, Shoes & Jewelry, led by men’s jeans
Average price
$57.64
Dominant seller
Amazon.com (US, 95.2%)
Brand Score
7.1 / 10
Avg. rating
4.43 (43.4M reviews, the most on this list)
12-month growth
+50.8%
Levi's brings iconic-brand heritage to the ranking, led by men's jeans at an accessible $58 average price. Amazon is the seller on 95.2% of its sales, a near-pure first-party vendor relationship. What stands out most is trust: with 43.4 million reviews,
Levi's has the largest review base of any brand here by a distance, and it paired that with 50.8% yearly growth. Heritage plus volume is a powerful combination.
10. VEVOR
Metric
Details
Est. monthly revenue
$71.6M (TTM $949.7M)
Top category
Patio, Lawn & Garden, led by garden carts
Average price
$177.41
Dominant seller
Amazon.com (US, 76.2%)
Brand Score
8.6 / 10 (highest on the list)
Avg. rating
4.23 (790K reviews)
12-month growth
+42.3%
VEVOR rounds out the top 10 and carries the highest Brand Score of any brand here at 8.6, ahead of even Apple and Amazon Basics. The China-based equipment and tools brand sells everything from garden carts to workshop gear at a mid-range $177 average price, with Amazon as the dominant seller on 76.2% of sales.
Paired with 42.3% yearly growth, that combination of a top score and fast momentum makes VEVOR one of the brands most likely to climb this list in the coming year.
*TTM stands for Trailing Twelve Months. It's the total revenue over the most recent 12 months, counting backward from today rather than following the calendar year.
What Is an Amazon Vendor Brand?
On Amazon, a vendor brand is one that sells its products wholesale to Amazon through Vendor Central, and Amazon then resells them as a first-party (1P) retailer. You can spot this in the data through the "dominant seller" figure: when Amazon.com is the seller behind most of a brand's sales, that brand is operating largely as a 1P vendor.
When an independent seller is dominant instead, the brand is sold third-party (3P), often by its own owner or a network of resellers. Most of the biggest names below are vendor brands, but not all, and that distinction explains a lot about how each one operates. If you want the broader picture, SmartScout's 1P vs 3P report breaks down the split across the whole marketplace.
What the Data Says About Amazon's Biggest Brands?
Line these brands up side by side, and a few patterns explain how a brand reaches the top of Amazon.
1. Electronics and High Prices Still Rule
Apple, Samsung, HP, and Sony are all electronics brands, and most of the list carries average prices above $100, topping out at Samsung's $977. A high average price means a brand needs far fewer units to post big revenue. The exceptions, Amazon Basics, Nintendo, and Levi's, prove the other route: win on sheer volume at lower prices instead.
2. Most of These Are Sold by Amazon Itself
For the majority of this list, Amazon.com is the dominant seller, including Apple at 67%, Amazon Basics at 99.8%, TRQ at 93.3%, Levi's at 95.2%, and VEVOR at 76.2%. That is the signature of a first-party vendor brand: the company sells wholesale to Amazon, and Amazon resells. The clearest exception is Windscreen4less, sold entirely by a single third-party seller, with HP and Sony sitting in between at roughly half their sales running through Amazon and half through independent resellers.
3. A Perfect Brand Score Is Not Required
VEVOR leads on Brand Score at 8.6, with Amazon Basics and TRQ close behind at 8.2, yet the two biggest brands by revenue, Apple and Samsung, sit at 7.7, and Sony cracks the top eight at just 6.6. Revenue and Brand Score measure different things. A strong multinational brand can dominate sales without a flawless score, which is good news for any seller worried about hitting a perfect grade.
4. Growth Is Where the Real Story Lives
Size tells you where a brand is today, but growth tells you where it is headed, and the two often diverge. TRQ surged 262% in a single month, Nintendo is up 187% over the year on the Switch 2 launch, and Levi's, VEVOR, and Samsung all grew 40% or more, while the biggest name of all, Apple, inched up just 5.7%. The fastest risers are rarely the biggest brands, which is exactly where opportunity tends to hide.
How to Find Growing Amazon Brands With SmartScout
Every number in this article came from one place, and you can run the same analysis on any category in minutes. Here is the workflow behind the ranking above.
Sort the field. Open the Brands database and filter by estimated revenue, growth rate, or Brand Score to surface both the leaders and the fast risers in any niche.
Find the gaps. Use the Subcategories browser to spot categories where demand is high but no single brand has taken control, the openings where a new entrant can realistically compete.
Check who controls the sales. Review the dominant seller and 1P versus 3P split with Seller Tools to judge whether a brand is wholesale-friendly or locked down by its owner.
Pressure-test the margin. Before sourcing anything, run it through the FBA Calculator so you know your real net after fees.
The Bottom Line: Apple is currently the largest vendor brand on Amazon
Amazon's largest brands do not share a category, a price point, or even a business model. Apple wins on premium electronics, Amazon Basics on private-label volume, TRQ and Nintendo on explosive growth, and Windscreen4less on owning its niche end to end.
What unites them is scale built on a clear strategy, whether that is a first-party vendor relationship, a private label, or a heritage name with millions of reviews. The brands worth watching, though, are the ones growing fastest, and the same data that surfaced this list will surface them in any category you choose to study.
If you feel like you’ve hit a growth ceiling on Amazon, expanding your brand onto TikTok is one of the smartest scaling moves you can make right now.
These two platforms, however, operate on completely different buyer mindsets.
Amazon is a high-intent search engine where users go specifically to buy things they already know they want. TikTok, on the other hand, is a discovery engine where users stumble upon products they didn't even know they needed until it popped up on their feed.
Here you'll learn the most effective ways to adapt your current Amazon business for the TikTok ecosystem.
Key Takeaways
Search vs. Discovery: Amazon relies on high-intent search and TikTok drives rapid impulse buys through mobile-first video discovery.
Low Fees Fund Affiliates: TikTok’s flat 6% referral fee frees up the margin you need to recruit top-tier creators using lucrative "Targeted Plan" commissions.
Fulfillment Flexibility: Ship seamlessly from your existing FBA pool using Amazon MCF, or use Fulfilled by TikTok (FBT) for cheaper base fees and an algorithmic boost.
Strict Logistics Probation: New shops face daily order caps. You must maintain a >95% Valid Tracking Rate and <4% Late Dispatch Rate to graduate and unlock unlimited volume.
Listing Imports: You cannot bulk-sync your Amazon catalog. Instead, bypass manual entry by using TikTok's List with a URL tool to instantly scrape and draft individual product pages.
Track the "Halo Effect": Viral TikTok videos organically spike your Amazon Best Sellers Rank. Measure this spillover using Amazon Attribution links and Search Query Performance.
Why Sellers Love TikTok Shop
The massive influx of e-commerce sellers flocking to TikTok Shop isn't just driven by hype, it is backed by superior unit economics and a frictionless buyer journey. When compared to the climbing overhead of Amazon or the uphill battle of driving cold traffic to a standard DTC storefront, TikTok Shop hits a highly profitable sweet spot.
By combining slashed platform fees, an instant checkout process, and a built-in marketing ecosystem, the platform has fundamentally changed how digital brands capture volume.
Before we dive deeper, let's first take a closer look at the core reasons sellers love the platform:
Strikingly Lower Referral Fees
If you are used to Amazon taking a 15% to 30% cut of your top-line revenue just for the referral fee, TikTok Shop is a breath of fresh air.
TikTok Shop’s platform referral fee sits at 6% all-in.
This lower fee gives you the extra margin cushion you need to fund creator commissions or run aggressive discounts to trigger the algorithm.
Zero-Friction Native Checkout
When you drop a link in your bio directing traffic to an external website, you lose a massive chunk of your audience at every click.
With TikTok Shop, the buyer clicks a product tag on a video, a native checkout drawer slides up, and they buy via Apple Pay or TikTok Pay in two clicks—without the video ever pausing. This friction-free process pushes conversion rates into the 3% to 5% range, easily beating standard direct-to-consumer (DTC) storefronts.
An On-Demand Affiliate Sales Force
Instead of managing complex influencer contracts, TikTok’s built-in Affiliate Marketplace lets you upload your product, set a commission rate (e.g., 15%), and make it available to hundreds of thousands of creators. They request free samples, create the content, and sell for you. You only pay them after a verified sale is completed.
The Amazon "Halo Effect"
The traffic generated on TikTok doesn't stay entirely on TikTok. Data shows a massive percentage of scrollers will see a product go viral, open their Amazon app, and search for the brand name directly to look at reviews or see if it’s Prime-eligible. Opening a TikTok Shop will almost always cause a natural, organic lift to your Amazon Best Sellers Rank (BSR).
TikTok Shop vs Amazon vs Shopify
Metric
TikTok Shop
Amazon
Shopify (DTC)
Platform / Referral Fee
~6%
15% - 30%
$39/mo + ~3% processing
Primary Discovery Model
Algorithmic feed (impulse)
Search engine (high intent)
You must drive all traffic
Average Conversion Rate
3% - 5%
~10%+ for branded or high-intent traffic
1% - 2%
Customer Data Ownership
Limited
None
Full ownership
A quick warning on margins: While the 6% fee is low, TikTok Shop requires tight inventory management. If an affiliate video goes viral, you can see a 10x demand spike overnight. If you stock out, TikTok's algorithm penalizes your shop visibility quickly.
Can You Integrate Amazon to TikTok Shop?
If you’re wondering how to add Amazon storefront to TikTok, there is no official button to directly connect your Amazon seller account or sync your listings to TikTok Shop. Instead, TikTok wants you to use their own Seller Center platform, meaning you have to upload and manage your product catalog over there specifically for your TikTok audience.
If you've ever dreaded launching on a new platform because of the sheer amount of manual data entry involved, TikTok has finally solved that problem.
Officially rolled out in the TikTok Shop Academy on May 13, 2026, the built-in "List with a URL" tool completely streamlines the onboarding process.
Instead of manually downloading your Amazon images or retyping descriptions, you can simply paste a single product link from either Amazon or Shopify directly into the TikTok Seller Center. The system instantly scrapes the page to generate a ready-to-edit draft listing.
Because this tool creates a draft, you have complete control to edit and optimize the copied information to better suit a mobile audience before hitting publish. The feature is currently limited to single-product URLs. This means you can’t copy your entire Amazon storefront all at once.
Additionally, if the product you are importing belongs to a restricted brand, you must apply for and secure brand authorization inside the TikTok platform before the system will allow you to copy and pull its information.
How to use "List with a URL"
Step
Action
Description
1. Navigate
Open Seller Center
Log in on your desktop, go to the Products tab, and click Product Listing.
2. Locate Tool
Find "List with a URL"
Look for the feature tile labeled List with a URL and click List Now.
3. Import
Paste Product Link
Grab the live URL of your single Amazon listing, paste it into the search bar, and click Import.
4. Optimize
Review the Draft
Open the generated draft to shorten bullet points, fill in missing details, and check image formatting for mobile.
5. Publish
Submit for Review
Once you are satisfied with the edits, hit Submit for review to push your product live.
Amazon Multi-Channel Fulfillment Apps (The Back-End Engine)
Once your product listings are live, you need a way to fulfill incoming viral orders without running out of stock or missing strict shipping windows. Since TikTok does not offer a direct, native API connection to Amazon, you will use Amazon Multi-Channel Fulfillment (MCF) combined with a third-party connector app to get the job done.
The biggest benefit of this setup is that you don't have to split your stock. You get to use a single pool of inventory sitting in Amazon's fulfillment centers to feed both your FBA Amazon sales and your TikTok Shop sales simultaneously.
If you're worried about TikTok's strict shipping speed rules, MCF has you covered. It offers standard delivery within three business days (with a 98% success rate) and provides real-time AFTN tracking numbers on 100% of orders to keep your TikTok account health in perfect standing.
Plus, you can protect your brand experience and prevent buyer confusion by toggling on the "Unbranded Packaging" option in MCF, ensuring Amazon ships your TikTok orders in blank boxes at no extra cost to you.
How to Automate TikTok Orders with Amazon MCF
Step
Action
Description
1. Choose a Connector App
Browse the TikTok App Store
Select an MCF-supported integration app like Pipe17, WebBee, CedCommerce, or Order Desk.
2. Authorize Accounts
Link your platforms
Follow the app's prompts to securely connect your TikTok Seller Center and Amazon Seller Central accounts.
3. Match Your SKUs
Sync product catalogs
Ensure your TikTok product SKUs are strictly identical to your Amazon FBA SKUs so the system knows exactly what to ship.
4. Enable Blank Boxes
Protect brand experience
Verify that "Unbranded Packaging" is active in your MCF settings so your TikTok buyers do not receive confusing Amazon Prime boxes.
5. Automate Fulfillment
Launch and sell
Once fully synced, incoming TikTok orders will automatically route to Amazon for picking, packing, and 2-to-3-day delivery.
Optimizing Your Amazon Listings for Mobile Scrollers
Amazon listings are built for the A9 search algorithm. They are packed with dense, keyword-stuffed titles and long paragraphs of text meant to be read on a desktop. If you blindly copy and paste that exact formatting into TikTok using the "List with a URL" tool, your conversion rate will tank.
TikTok is a mobile-first discovery engine. Users are scrolling rapidly and buying on impulse. They do not want to read a spec sheet. They want to know exactly what the product does for them in three seconds or less.
Amazon-to-TikTok Listing Optimization Checklist
Listing Element
Optimization Action
Target Specification
Product Title
Chop the title
Under 50 characters, with brand name and core benefit only.
Bullet Points
Gut the bullet points
3 short, punchy, emoji-driven bullet points max.
Listing Images
Lead with lifestyle images
High-energy mobile asset or lifestyle shot as the hero image.
FBT vs. Amazon MCF
If you are setting up your logistics, you will inevitably hear about Fulfilled by TikTok (FBT).
This is TikTok’s in-house 3PL network and their direct answer to Amazon FBA. When you use FBT, you send a portion of your inventory directly to TikTok-partnered warehouses, and they handle the picking, packing, and shipping.
Because TikTok desperately wants to control the end-to-end buyer experience, they heavily incentivize sellers to use FBT by giving those products a massive algorithmic visibility boost and protecting your account from negative strikes if a carrier delay occurs.
However, splitting your inventory between Amazon and TikTok creates cash-flow headaches. So, which one should you choose?
Storage & Fulfillment Comparison: TikTok FBT vs. Amazon FBA
Feature
Fulfilled by TikTok
Amazon FBA / MCF
The Bottom Line
Fulfillment Fee (1 lb item)
~$3.58 / unit
~$5.40 / unit
FBT is cheaper for base fulfillment.
Initial Storage Costs
Free for the first 60 days
Charged from Day 1
FBT wins early on with free storage.
Long-Term Storage Costs
Accelerates rapidly after 60 days
Steady monthly fee
Amazon is safer for slow-moving stock.
Multi-Unit Orders
Deep multi-item discounts
Minor volume breaks
FBT rewards bundling and multi-unit sales.
Inventory Pool
Requires split stock
Single unified pool
MCF protects cash flow by unifying stock.
The Verdict: If your product is highly viral, lightweight, and you know it will sell out quickly, TikTok FBT is the cheaper option, and the algorithm boost is worth the hassle of splitting stock. If your product is heavy, sells slowly, or you just want to test the waters without risking stranded inventory, stick to Amazon MCF.
How Strict Are TikTok’s Logistics Metrics?
Amazon sellers are used to strict metrics, but TikTok's account health enforcement is notoriously brutal.
Every new seller is automatically placed into the TikTok Shop Probation Program. During this phase, your shop is heavily restricted—often capped at a maximum of 50 to 100 orders per day. To graduate from probation and unlock unlimited daily orders, you must prove you can ship products fast without generating customer complaints.
The three metrics you must obsess over:
Valid Tracking Rate (VTR): Must be 95% or higher.
Late Dispatch Rate (LDR): Must stay below 4%. TikTok requires orders to be scanned by a carrier within two business days.
Seller-Fault Cancellation Rate: Must stay below 2.5%. If you run out of stock and have to cancel orders, your shop will be penalized immediately.
How MCF apps save you: If you are using Amazon MCF to fulfill orders, your third-party connector app (like Pipe17 or WebBee) is responsible for grabbing the Amazon tracking number and pushing it back to your TikTok Seller Center instantly. This ensures your VTR stays at 100% and you sail through the probation period without manual data entry errors.
How Brands Measure the "Halo Effect"
One of the greatest benefits of TikTok Shop is the massive wave of secondary traffic it sends back to your Amazon storefront. Many scrollers will watch a viral video, decide they want the product, but close TikTok and open their Amazon app to buy it using Prime shipping.
Because this traffic happens off-platform, it can feel impossible to track.
Here is how data-driven brands measure the Halo Effect:
Tracking Method
What to Track
Why It Matters
Brand Search Volume
Search Query Performance in Seller Central
TikTok spikes can lift branded Amazon searches.
BSR Lift
BSR vs. TikTok posting schedule
High TikTok views can improve Amazon rank.
Attribution Links
Clicks, Add to Carts, and sales from TikTok
Shows what TikTok traffic actually converts.
How to Recruit Creators from the Affiliate Marketplace
TikTok’s built-in Affiliate Marketplace is the engine that drives your sales, but creators won't just magically find your product. You have to actively recruit them and offer competitive financial incentives.
High-performing creators don't evaluate affiliate offers emotionally; they evaluate them economically. You will manage your recruits using two main commission structures:
Open Plan vs. Targeted Plan
Feature
Open Plan
Targeted Plan
What it is
A public commission rate available to any approved creator.
A private, higher commission rate offered to hand-selected creators.
Average Commission
10% to 15%
18% to 25%+
Best Used For
Generating initial volume and catching the long tail of micro-influencers.
Locking in proven, high-converting creators and poaching from competitors.
Sample Strategy
Use refunded samples, where they buy it and you refund after posting, to filter out freebie hunters.
Offer free samples directly to remove all friction for top-tier talent.
Pro Tip: Do not underprice your Open Plan. In 2026, serious creators expect category minimums (e.g., Beauty sits at a 20% floor). If you set your Open Plan at 5%, the creators who actually move volume will simply scroll past your shop.
Going live on TikTok is one of the easiest ways to build real-time engagement with your audience.
For creators, it is a chance to connect with followers, answer questions, and grow a loyal community. For sellers, it can turn product demos, live Q&As, and limited-time offers into direct sales opportunities.
Here's a step by step guide on how to do TikTok Live, including what you need before you stream, how to go live from a mobile device, and how to stream from a PC using TikTok LIVE Studio or OBS. You’ll also learn practical tips for keeping viewers engaged, improving stream quality, and using live content more strategically as a creator or eCommerce seller.
Key Takeaways:
Requirements: You need at least 1,000 followers and must be 18 years or older to unlock the LIVE feature and receive gifts.
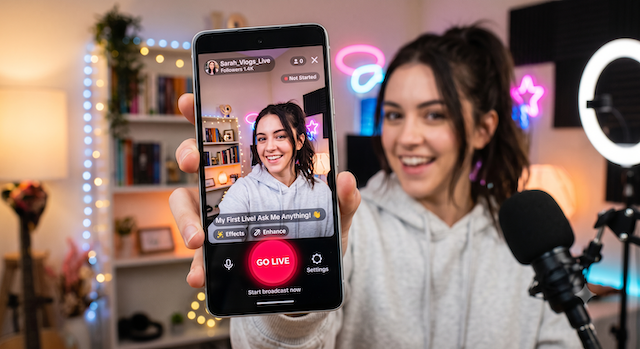
Mobile Streaming: Tap the + button, select LIVE from the bottom menu, add a compelling title, and hit Go LIVE.
PC Streaming: Use TikTok LIVE Studio for an all-in-one desktop setup, or configure OBS Studio using your TikTok stream key.
Best Practices: Start engaging immediately, use an eye-level camera angle, and ensure you have a highly stable internet connection.
Reasons Why You Should Stream
Benefit
Impact & Details
Higher Conversion Rates
Streams convert at an average of 7.8% (3.7x higher than standard feed ads).
Algorithm Boost
The 2026 TikTok algorithm heavily favors Live accounts, pushing content to niche micro-communities.
Instant Audience Trust
Real-time Q&As and product demos make viewers more comfortable purchasing from a new seller.
Immediate Revenue
76% of users who join a Live session end up making a purchase.
Massive Boost in E-Commerce Revenue
TikTok Live directly impacts your bottom line by enabling frictionless, in-app purchases. Live shopping drives 26% of TikTok's GMV with a 7.8% conversion rate. This outperforms the 2.1% rate of standard video ads. Going live creates urgency. Hosting flash sales and limited-time discounts pushes viewers to buy immediately.
Unrivaled Real-Time Engagement
Live streams offer a two-way conversation that static videos cannot match. Live video drives 38% higher engagement than pre-recorded content. Answering questions and acknowledging viewers by name builds trust, converting casual scrollers into loyal customers and boosting your visibility on the "For You" page.
Seamless Integration with Amazon FBA Strategies
TikTok Live is a powerful external traffic engine for Amazon sellers. Addressing pain points and demonstrating products live sends highly motivated buyers to your storefront, increasing conversion rates on your listing and improving organic ranking.
Pro Tip: Use a product research tool to verify search volume and an FBA calculator to ensure your external traffic remains profitable after fees.
Better Product Discovery Than Static Images
Live streaming showcases the true scale and quality of your ASIN, eliminating buyer hesitation. Podbase data shows 76% of users who join a Live session make a purchase because authentic, real-time demonstrations provide ultimate social proof. Conduct Amazon competitor analysis beforehand to clearly highlight on stream why your product beats the competition.
What You Need Before You Stream on TikTok
Before you set up your camera and start engaging with your audience, TikTok enforces strict eligibility rules to maintain platform quality.
Here is exactly what you need to have in place before you can go live.
Requirement
Details
1,000 Followers
The official, globally enforced requirement.
18 Years of Age
You must be 18 or older to broadcast. Strictly enforced due to monetization features (virtual gifts and Diamonds).
Clean Account Health
No recent policy violations or active restrictions. Check TikTok inbox for any moderation notices.
Stable Wi-Fi Connection
Always prioritize Wi-Fi over cellular LTE data to prevent freezing or lagging during your stream.
Proper Lighting
Face your light source — never behind you. A ring light at eye level keeps your face clear and shadow-free.
Clear Audio
Stream from a quiet room or use a plug-in microphone to reduce ambient noise.
Up-to-Date App
Run the latest version of TikTok. If the LIVE tab is missing, force-close the app and update it.
How to Do TikTok Live on a Mobile Device
Most creators start on mobile because it requires minimal gear. Here is how to start your first broadcast:
Open the App: Launch TikTok and tap the + (Add Post) button at the bottom center of your screen.
Select LIVE: Swipe through the bottom menu options (Post, Create, Live)
Set Up Your Stream: * Add a Title: Keep it under 32 characters. Use a specific hook like "Live Product Q&A" rather than a generic "Going Live."
Choose a Category: If you are streaming mobile games, select the gaming category.
Adjust Settings: Tap the three dots to manage your mic, mirror your camera, or add moderators. You can also set a live goal to incentivize viewers to send gifts.
Go LIVE: Once your lighting is dialed in and your internet connection is stable, tap the red Go LIVE button.
How to Stream on TikTok from a PC
Streaming on TikTok from a PC gives you more control than going live from your phone. It is especially useful if you want to stream gameplay, share your screen, use a webcam and microphone setup, or create a more polished broadcast with overlays and scenes.
To stream from a desktop, you can use TikTok LIVE Studio for a simple all-in-one setup or OBS Studio if you already have access to a TikTok stream key. In this section, we’ll walk through both options so you can choose the setup that fits your content, technical comfort level, and streaming goals.
Option A: TikTok LIVE Studio (Recommended for Beginners)
TikTok LIVE Studio is a free application that makes PC streaming incredibly simple.
Download the software and log in.
Add your display capture, webcam, and microphone using the built-in scene templates.
Adjust your stream quality (1080p at 60fps is highly recommended if your connection allows it).
Manage your chat and moderation tools directly within the same window.
Option B: OBS Studio (For Advanced Users)
If you already use OBS for Twitch or YouTube, you can route it to TikTok.
Locate your TikTok Server URL and Stream Key (found in the TikTok Live Center on desktop).
Paste these credentials into the Custom Stream Server settings in OBS.
Note: Keep your stream key private. If leaked, anyone can broadcast to your account.
TikTok Live Monetization Mechanics
Going live isn't just about building a community; it is a direct avenue for generating revenue. TikTok offers robust, built-in monetization tools that allow you to earn money natively during your broadcast.
Here is how the two primary income streams work.
TikTok Shop Integration
For e-commerce sellers, integrating TikTok Shop is the most lucrative monetization strategy. This feature allows viewers to purchase your products directly within the app, creating a frictionless buying experience.
Here is exactly how to pin a product to your live stream:
Link Your Shop: Ensure your TikTok Shop or affiliated store is fully set up and linked to your creator account before broadcasting.
Access the Product Tool: While setting up your LIVE (or during the broadcast), tap the Shopping Bag icon on the screen.
Select Your Items: Choose the specific products from your catalog that you will be discussing or demonstrating during the stream.
Pin to Screen: Tap Pin next to a product to highlight it. A small, clickable product card will appear on the viewer's screen.
Direct the Traffic: Tell your audience to click the pinned card. They can complete their checkout seamlessly without ever leaving your live stream.
Seller Tip: Do not just pin a product and hope for the best. Use an FBA calculator to understand your true margins, and run exclusive, time-sensitive "Live Only" flash sales to create extreme buying urgency.
Virtual Gifts and Diamonds
Even if you aren't actively selling a physical product, you can monetize your live stream through TikTok's virtual gifting economy.
LIVE Gifts let viewers support creators during a TikTok LIVE. When you turn on LIVE Gifts and start streaming, viewers can send virtual Gifts that appear on the screen in real time.
These Gifts are a way for viewers to react to your content, show appreciation, and help make your LIVE more engaging. As your LIVE becomes more popular, TikTok may award you Diamonds based on the activity and support your stream receives.
After your LIVE ends, you’ll see the total number of Diamonds collected in your LIVE summary. Receiving Gifts and collecting Diamonds must follow TikTok’s virtual items policies.
Here is how the mechanics of gifting work:
Viewers Buy Coins: Users purchase virtual "Coins" using real money through the TikTok app.
Viewers Send Gifts: During your stream, viewers can use their Coins to send you digital animations (Gifts), ranging from a simple "Rose" to massive screen-covering animations.
You Earn Diamonds: When you receive a Gift, TikTok awards your account with "Diamonds." Diamonds are the metric TikTok uses to measure a creator's popularity and content quality.
Converting to Cash: Once you accumulate enough Diamonds, you can withdraw them for fiat currency via PayPal or a linked bank account. TikTok takes a percentage of the revenue (typically around 50%) during this conversion process.
As long as your account meets the eligibility requirements outlined earlier, you can withdraw your Diamonds for fiat currency. To maximize this income stream, set up "Live Goals" before you start broadcasting. Reminding your audience of these goals throughout the stream is a proven way to incentivize more Gifts.
TikTok LIVE replays
TikTok LIVE replays are saved recordings of your previous LIVE videos. You can view, download, or clip them for up to 30 days after your stream ends.
TikTok saves LIVE videos so creators can access their replays, download past streams, or turn highlights into clips. These recordings also help TikTok improve content moderation and respond to content that may violate its Community Guidelines.
To find your LIVE replays, open the TikTok app and go to your Profile. Tap the Menu button at the top, then select TikTok Studio. From there, tap LIVE, then choose LIVE recordings.
You can also access your LIVE replays through the LIVE Center.
Action
Steps
Download a replay
Profile > Menu > TikTok Studio > LIVE > LIVE recordings > locate the replay > tap Download.
Clip a replay
Profile > Menu > TikTok Studio > LIVE > LIVE recordings > locate the replay > tap Clip > edit, then tap Next to post or Save for later.
Delete a replay
Profile > Menu > TikTok Studio > LIVE > LIVE recordings > locate the replay > tap Delete.
FAQs
How to Do TikTok Live: A Simple Step-by-Step Guide for Creators and Sellers
The Helium 10 vs. Jungle Scout debate has remained relevant for more than a decade.
These two platforms have dominated the Amazon seller tool space since 2015, and nearly every FBA seller has used one or both at some point. But the question that keeps coming up in every Amazon seller community, subreddit, and Facebook group is the same: which one should you actually pay for?
Both tools have changed significantly in 2026. Helium 10 removed its affordable Starter plan, raised prices across the board, and expanded into Walmart and TikTok Shop. Jungle Scout rebranded its entire plan structure under the "Catalyst" name, refined its AI tools, and doubled down on what it has always done well: helping sellers find and launch products on Amazon.
Both platforms look similar on the surface. They're not. Here's exactly where they differ and which one is worth your money in 2026.
Helium 10 vs Jungle Scout: Quick Verdict
Jungle Scout Catalyst is the better choice for beginners, budget-conscious sellers, and anyone focused on product research and validation. Its simplified workflows, superior supplier database, and lower pricing make it the smarter entry point into Amazon selling.
Helium 10 is the better choice for experienced sellers who need advanced keyword research, PPC automation, and multi-channel selling across Amazon, Walmart, and TikTok Shop. Its tool depth is unmatched, but the pricing reflects that.
That said, both tools share a common gap: neither provides brand-level market intelligence, subcategory revenue analysis, or seller mapping. Sellers who need that strategic market view often pair Helium 10 or Jungle Scout with a dedicated market intelligence platform like SmartScout, using it to identify opportunities at the brand, category, and seller level before moving into product research and optimization.
Here is a side-by-side snapshot of how both tools stack up across every major capability. Pay attention to the three rows near the bottom (Brand Intelligence, Traffic Analysis, Seller Mapping), as they highlight where both platforms have blind spots.
Parameter
Helium 10
Jungle Scout Catalyst
Specialization
All-in-one seller suite with 20+ tools
Beginner-friendly product research and launch platform
Best For
Experienced sellers and scaling operations
New sellers, SMBs, and product validation
Product Research
Black Box with advanced filters
Product Database and Opportunity Finder
Keyword Research
Cerebro and Magnet with deep ASIN-level data
Keyword Scout with simpler, actionable insights
Listing Optimization
Scribbles and AI Listing Builder with ChatGPT
Listing Builder with AI Assist
PPC Management
Adtomic with full automation and AI-driven campaign support
Advertising Analytics through Growth Accelerator+
Supplier Sourcing
Supplier Finder through Alibaba via Chrome extension
Supplier Database with global, vetted suppliers and shipment data
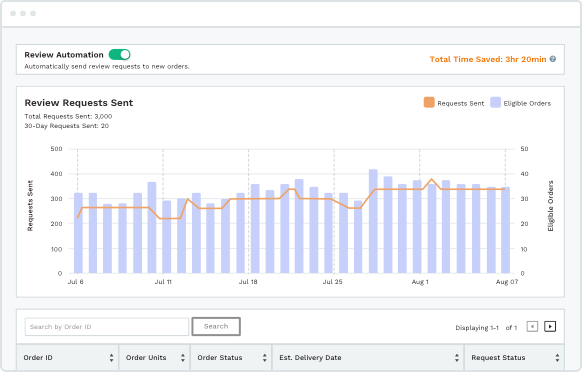
Review Automation
No built-in tool
Yes, through Growth Accelerator+
Rank Tracking
Up to 2,500 keywords per product with daily updates
Rank Tracker with relevancy scoring
Inventory Management
Yes, through the Diamond plan
Inventory Manager through Growth Accelerator+
Chrome Extension
Xray, paid and Chrome only
Free extension for Chrome and Firefox
Brand Intelligence
Market Tracker at the product level
No brand-level analytics
Traffic Analysis
No equivalent
No equivalent
Seller Mapping
No equivalent
No equivalent
AI Tools
AI chat, listing builder, and PPC automation
AI Assist for chat, listings, review analysis, and analytics
Free Trial
Free plan with limited access
7-day money-back guarantee
Starting Price
$129/month for the Platinum plan
$49/month for the Starter plan
Trustpilot Rating
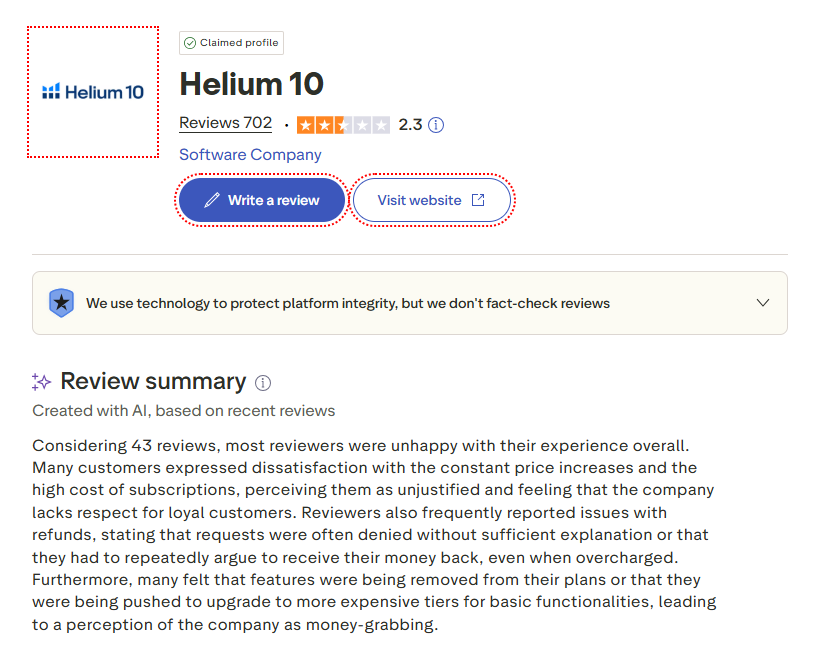
2.3/5 from 700+ reviews
4.2/5 from 3,900+ reviews
The table makes one thing clear: these tools overlap in many areas but differ sharply in philosophy. Helium 10 goes wide and deep. Jungle Scout keeps things focused and accessible. And both leave market-level intelligence off the table entirely.
Who Should Choose Helium 10?
Go with Helium 10 if:
You already have an established Amazon business and want advanced optimization tools
You sell on Walmart or TikTok Shop in addition to Amazon
You want granular keyword data with Cerebro's IQ Score and advanced filtering
You need full PPC campaign automation, not just analytics
You manage multiple seller accounts and need the Diamond plan's multi-user access
Skip Helium 10 if:
You are launching your first product and want a guided workflow
You are on a tight budget (no plan under $129/month)
You need a built-in supplier database for sourcing products
You find 20+ tools overwhelming and prefer a streamlined interface
You want brand-level competitive intelligence or seller mapping (consider SmartScout instead)
Who Should Choose Jungle Scout?
Go with Jungle Scout if:
You are a new Amazon seller learning the ropes
You want product research, supplier sourcing, and listing tools in one affordable package
You run a small-to-medium business and need solid data without enterprise complexity
You want automated review requests built into your plan
You prefer a clean, intuitive interface with a shorter learning curve
Skip Jungle Scout if:
You sell on Walmart or TikTok Shop (Jungle Scout is Amazon-only)
You need advanced PPC bid automation and campaign management
You want the deepest possible keyword research with ASIN-level reverse lookups
You need to analyze entire brand ecosystems and wholesale opportunities
Helium 10 vs Jungle Scout: Platform Overviews
Helium 10 and Jungle Scout have been the biggest competitors against each other for the last decade. Millions of seller trust both tools for their capabilities. Let’s know more about them.
Helium 10 Overview
Helium 10 launched in 2015 as a Chrome extension built by Manny Coats and Guillermo Puyol. The idea was simple: give Amazon sellers the most accurate marketplace data available. Over the years, it expanded into a massive suite of 20+ integrated tools covering product research, keyword analysis, listing creation, PPC management, inventory tracking, and refund recovery.
In 2026, Helium 10 made two significant moves. First, it retired the $39 to $49 Starter plan, making Platinum ($129/month) the cheapest paid option. Second, it expanded beyond Amazon with full Walmart marketplace support and TikTok Shop tools, including a listing converter, influencer finder, and profitability calculator. The platform now positions itself as a multi-channel e-commerce toolkit rather than a pure Amazon tool.
Training comes via the Freedom Ticket course by Kevin King, included free with every paid plan. The course is regularly updated and remains one of the most comprehensive Amazon FBA training programs available.
Related: See how Helium 10 compares to SmartScout's market intelligence in our SmartScout vs Helium 10 comparison.
Jungle Scout Overview
Jungle Scout also launched in 2015, founded by Greg Mercer after his early experience selling supplements on Amazon. The platform started with a singular focus: helping sellers find profitable products to sell. That DNA still runs through everything Jungle Scout builds.
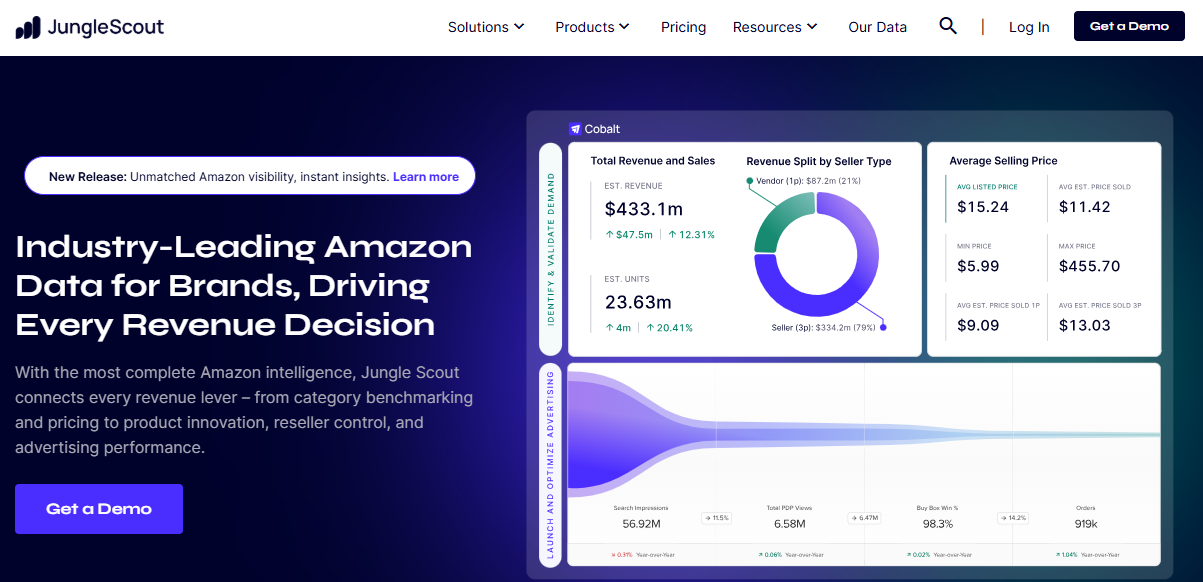
In 2026, Jungle Scout rebranded its seller plans under the "Catalyst" umbrella. The old Basic, Suite, and Professional tiers are now Starter ($49/month), Growth Accelerator ($79/month), and Brand Owner ($149/month). For enterprise brands doing over $5 million annually, Jungle Scout offers Cobalt, a separate competitive intelligence platform with custom pricing.
Jungle Scout tracks over 600 million ASINs and uses 11 years of refined sales estimation algorithms. The AI Assist feature now spans four areas: sales analytics, review analysis, listing building, and an always-on Q&A chat. The Jungle Scout Academy provides free training modules for every plan.
Helium 10 vs Jungle Scout: Feature-by-Feature Comparison
Both tools promise to help you sell more on Amazon. But their approaches differ in meaningful ways. Here is how they compare across every feature that actually matters to your bottom line.
1. Product Research
Helium 10: Black Box
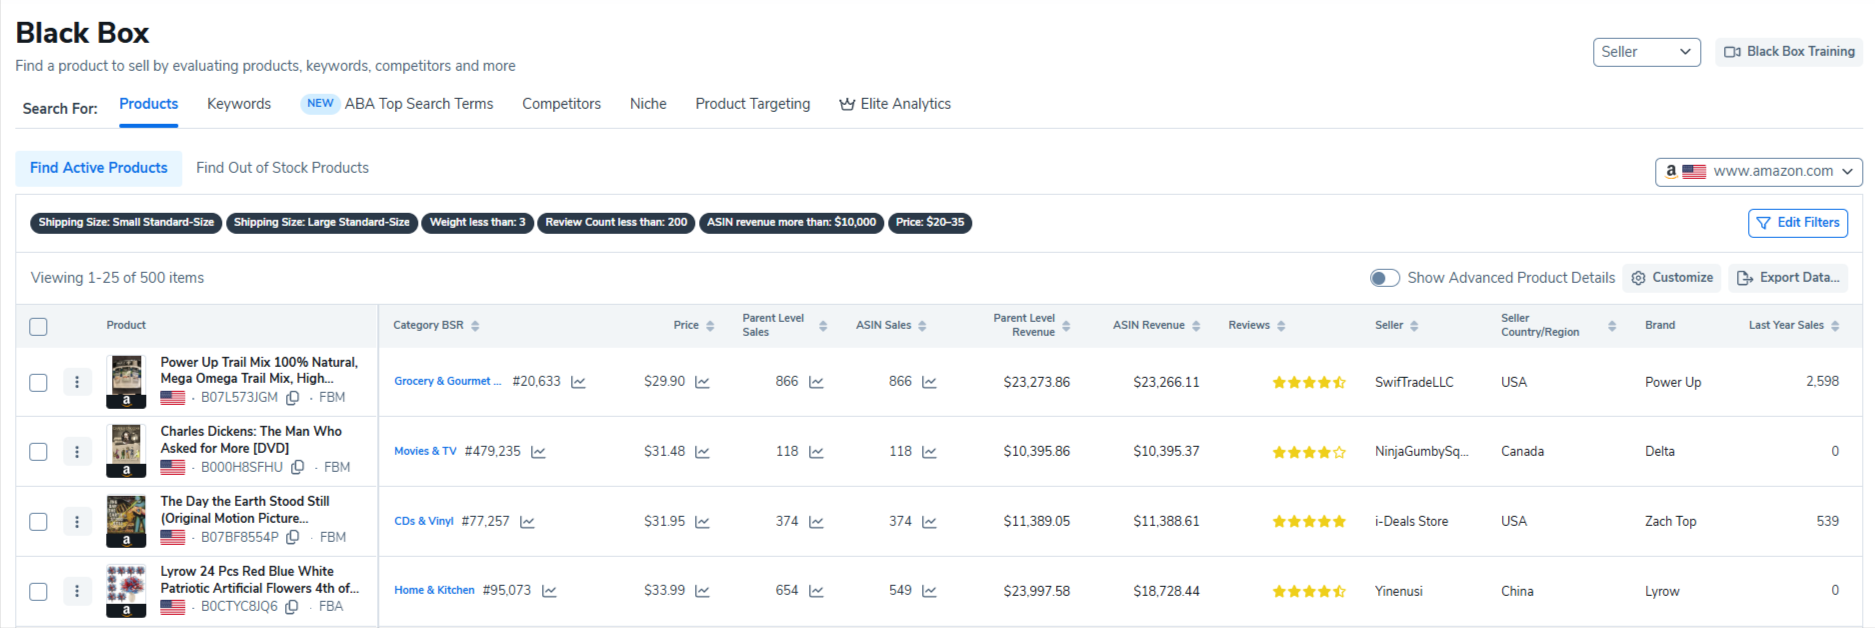
Black Box is Helium 10's primary product research tool. It uses advanced filters, including price range, monthly revenue, review count, weight, category, and BSR to generate a list of product opportunities. The filters are highly configurable, and experienced sellers can create very specific search criteria to uncover niche products.
One advantage of Black Box is its integration with the broader Helium 10 suite. You can run a product search, click through to Cerebro for keyword analysis, and then move directly into the Listing Builder without leaving the platform.
Jungle Scout: Product Database + Opportunity Finder
Jungle Scout splits its product research across two complementary tools. The Product Database works similarly to Black Box with filters for demand, competition, revenue, and category. Beginners who have no idea where to start can use preset filters to discover profitable categories immediately.
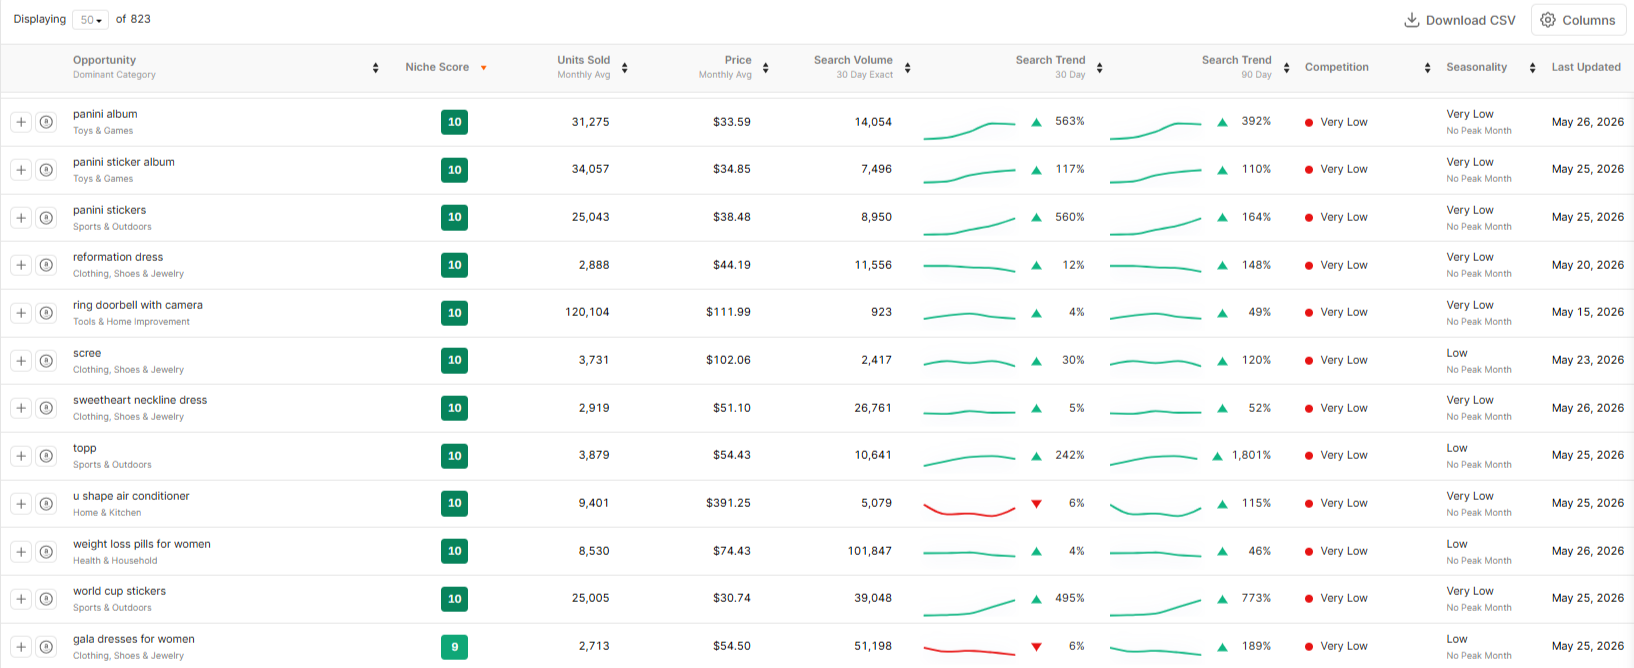
The Opportunity Finder adds something Black Box does not offer: a dedicated niche scoring system. The tool assigns a Niche Score from 1 to 10 based on demand, competition, and listing quality within a subcategory. Sellers targeting low-competition, high-demand products should aim for scores between 7 and 10.
Our Verdict: Jungle Scout wins for beginners and niche discovery thanks to the Opportunity Finder and its scoring system. Helium 10 wins for experienced sellers who want maximum filter control and tight integration with keyword tools.
Going deeper: Both tools approach product research from the bottom up, starting with individual products. SmartScout's Subcategories tool takes the opposite approach: start with 40,000+ subcategories, view revenue data and brand distribution, and then drill into individual products. This top-down method helps sellers discover profitable niches that product-level filters would never surface. See how it works in our resource guide.
Also Read: For a three-way comparison including market intelligence capabilities, check out our detailed SmartScout vs Helium 10 vs Jungle Scout breakdown.
2. Keyword Research
Helium 10: Cerebro and Magnet
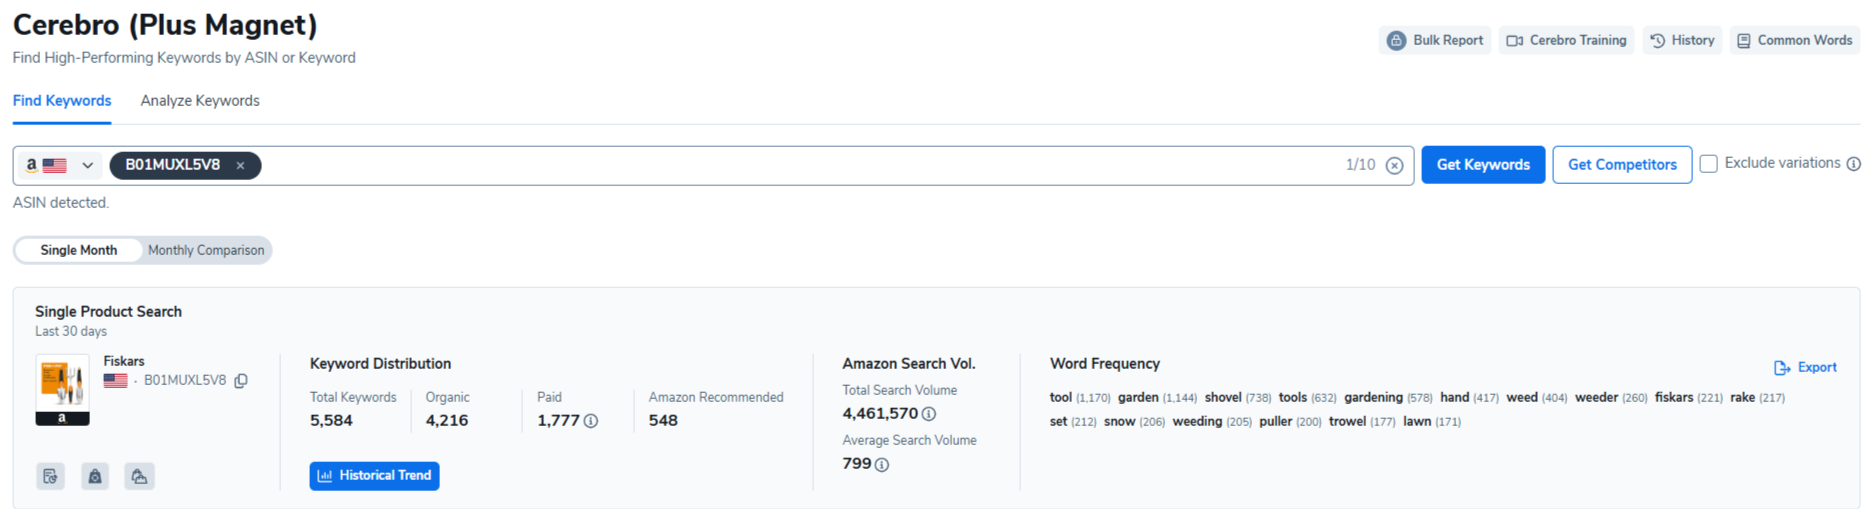
Cerebro is the most advanced Amazon keyword research tool on the market. Enter a competitor's ASIN, and Cerebro returns a complete keyword profile with search volume, organic and sponsored rank positions, the proprietary IQ Score, word frequency analysis, and top 10 title density. The IQ Score is particularly useful: a high score means strong search volume with low competition.
Magnet complements Cerebro by expanding seed keywords into comprehensive lists with monthly search volume data, trending direction, and related keyword suggestions. Both tools update their data daily.
Jungle Scout: Keyword Scout
Keyword Scout provides keyword research through seed keywords or ASIN-based reverse lookup (up to 10 ASINs). You get estimated monthly searches, trend direction (up, down, or flat), competition level, and an Opportunity Score that combines volume and competition into a single metric.
Keyword Scout also shows top advertisers bidding on each keyword and provides PPC cost estimates. For sellers running or planning sponsored campaigns, this advertising context is immediately actionable. The trade-off is that Keyword Scout does not offer the same depth of filtering or the granular distribution data that Cerebro provides.
Our Verdict: Helium 10 wins. Cerebro and Magnet together represent the gold standard for Amazon keyword research. The IQ Score, daily data updates, and advanced filtering options give experienced sellers tools that Keyword Scout cannot match in raw depth. That said, Keyword Scout's simpler approach with the built-in Opportunity Score works perfectly for sellers who want actionable data without a steep learning curve.
Complementary approach: SmartScout's Keyword Detective and Search Terms Relevancy tools answer a different question than Cerebro or Keyword Scout. Instead of just showing search volume, they map the relevancy and intent behind search terms at the product and category level. Sellers who want to understand why customers search for certain products, not just how often, find this layer of context invaluable for PPC targeting and listing strategy.
3. Listing Optimization
Helium 10: Scribbles and Listing Builder
Helium 10 approaches listing optimization as a two-step process. Scribbles analyzes keyword distribution across your listing components, showing where important keywords are missing from your title, bullets, description, and backend search terms. The Listing Builder then uses ChatGPT integration to generate optimized copy for each section.
For existing listings, Helium 10 provides green and red health indicators highlighting sections that need attention. The combination is powerful for sellers who already have products live and want to improve their organic rankings.
Jungle Scout: Listing Builder with AI Assist
Jungle Scout's Listing Builder pulls keywords from Keyword Scout and uses AI Assist to generate titles, bullet points, descriptions, and backend terms. The AI has improved significantly through 2025 and into 2026, now offering customer sentiment analysis and copy improvement suggestions.
One advantage Jungle Scout holds here is that AI Assist works for creating listings from scratch. You do not need an existing listing to optimize. For new product launches, you can go from keyword research to a fully drafted listing in minutes. Helium 10's Scribbles, by contrast, focuses primarily on optimizing existing listings.
Our Verdict: Tie. Helium 10 has the edge for optimizing existing listings with its detailed keyword distribution analysis and health scoring. Jungle Scout has the edge for creating new listings from scratch with AI Assist. Both platforms get the job done.
Related: SmartScout'sAI Listing Architect creates listings that combine keyword data with competitive positioning insights from SmartScout's brand and subcategory intelligence, giving your copy a strategic angle that standalone listing builders miss.
4. PPC Management
Helium 10: Adtomic (Helium 10 Ads)
Adtomic is a full-featured PPC management platform with AI-driven bid optimization, campaign structuring, budget guardrails, dayparting, and performance tracking. It integrates with Cerebro's keyword data to align targeting with search demand.
There is a catch, though. Adtomic is only fully included with the Diamond plan ($359/month). Platinum users can access basic ad features but not the full automation suite. On top of the subscription, Helium 10 charges a 2% management fee on all PPC spend managed through the platform. For sellers spending $10,000 per month on ads, that is an extra $200 in fees.
Jungle Scout: Advertising Analytics
Jungle Scout offers Advertising Analytics on Growth Accelerator plans and above. It provides campaign performance tracking, keyword-level ad data, and spending breakdowns. For enterprise brands, Jungle Scout Cobalt's Ad Accelerator adds rule-based bid automation, dayparting, and multi-account management.
The standard Catalyst plans focus on analytics and reporting rather than automated campaign management. If you want hands-off PPC optimization comparable to Adtomic, you need Cobalt's enterprise pricing.
Our Verdict: Helium 10 wins for PPC automation. Adtomic is the more mature and feature-complete PPC tool, and it is available at the Diamond tier without needing a custom enterprise quote. Jungle Scout's advertising analytics are useful for monitoring, but serious PPC management requires either manual work or upgrading to Cobalt.
PPC intelligence gap: Neither Adtomic nor Jungle Scout's Advertising Analytics shows you what your competitors are actually doing with their ad spend. SmartScout's Ad Spy fills that gap by revealing competitor keyword bidding patterns, estimated ad spend, and campaign structures. Understanding the competitive ad landscape before you set up campaigns makes every dollar you spend on Adtomic or any PPC tool more effective. Learn how to build a repeatable competitor analysis workflow.
5. Supplier Sourcing
Helium 10: Supplier Finder
Helium 10's Supplier Finder is a Chrome extension feature that shows supplier information when you browse Alibaba.
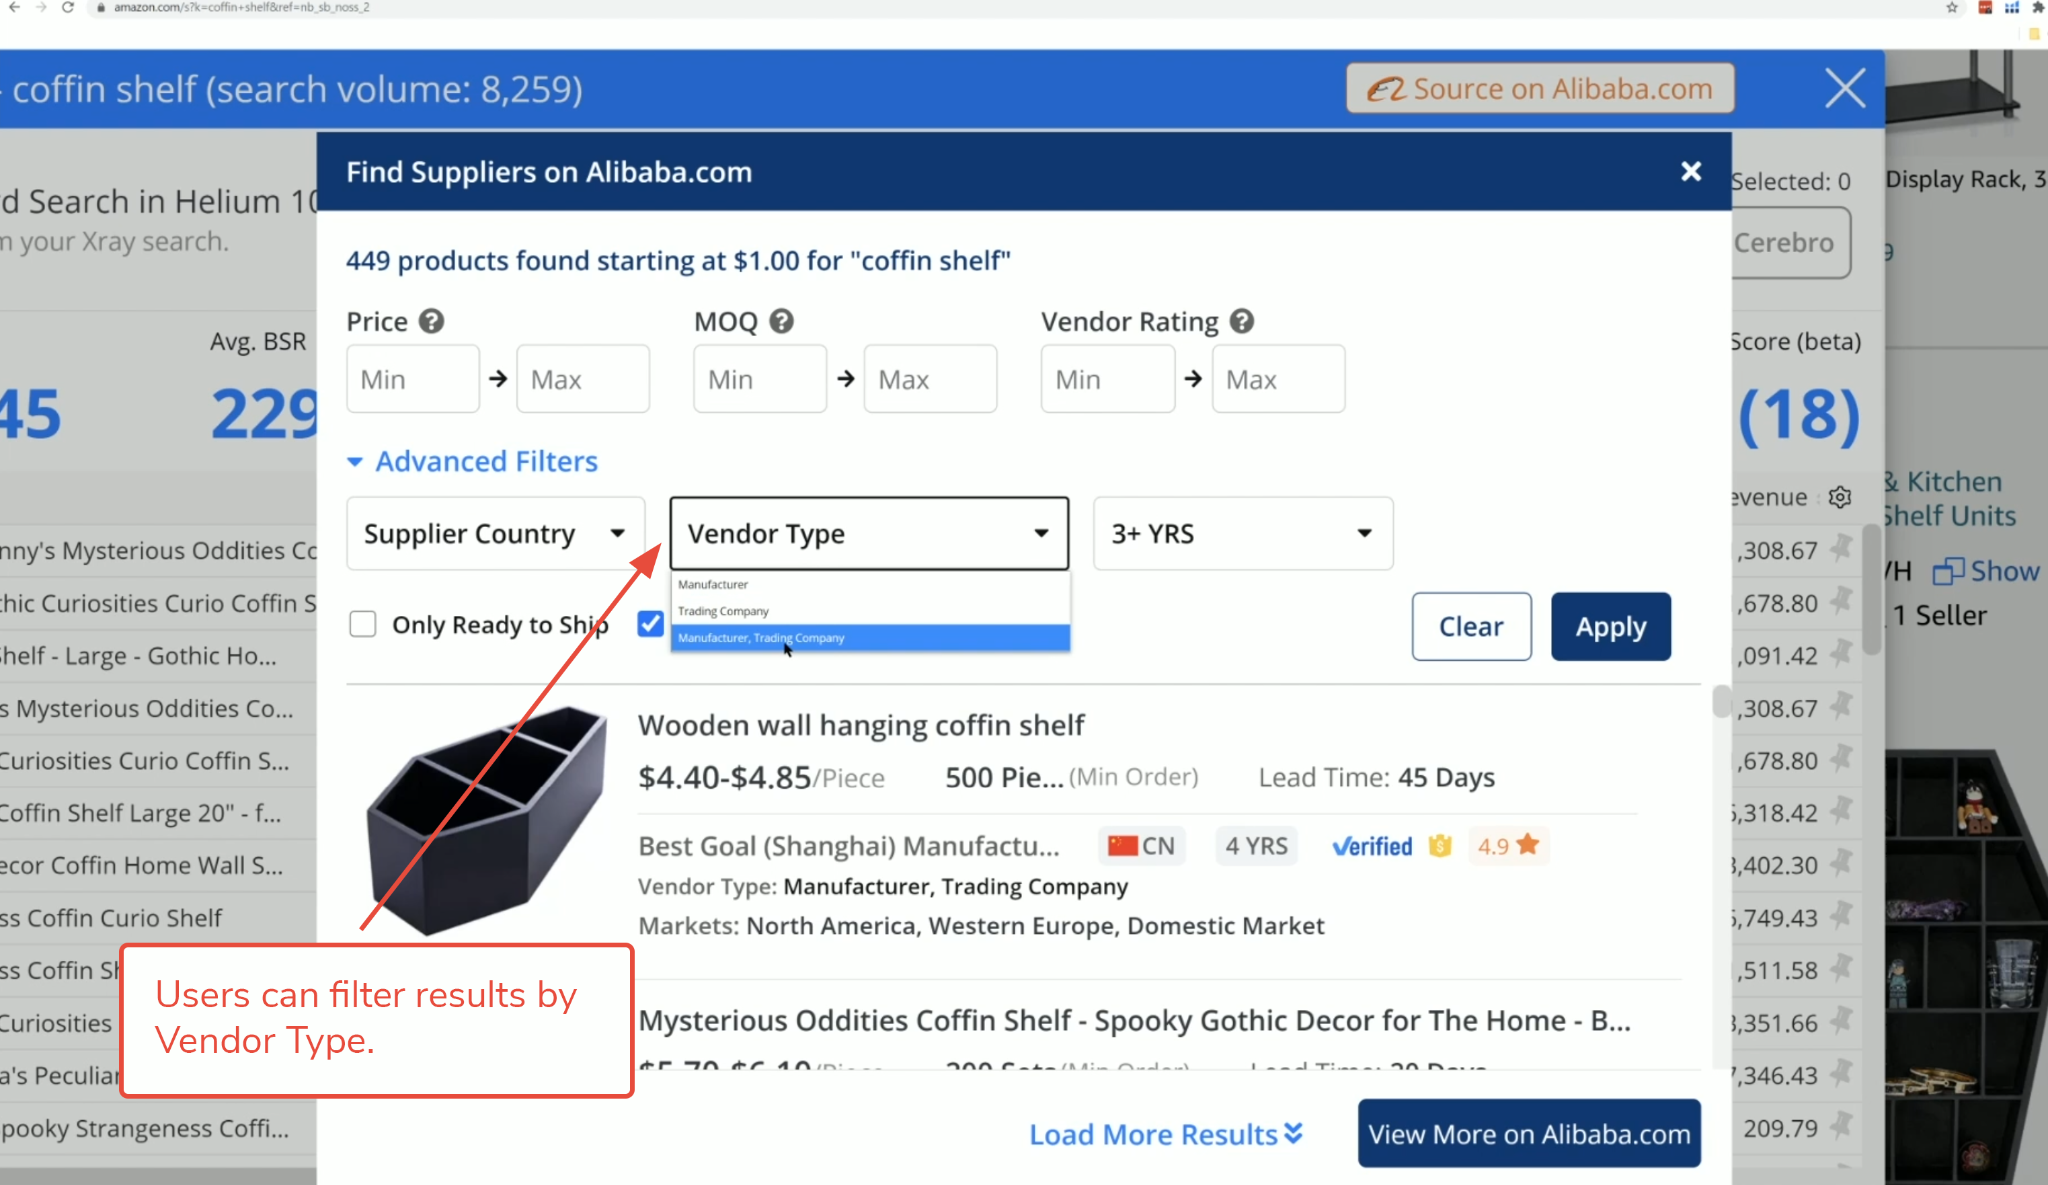
You can filter by price, minimum order quantity, and ratings. It is convenient for quick lookups, but it only covers Alibaba. There is no global supplier database, no shipment history data, and no way to vet suppliers within the Helium 10 platform itself.
Jungle Scout: Supplier Database
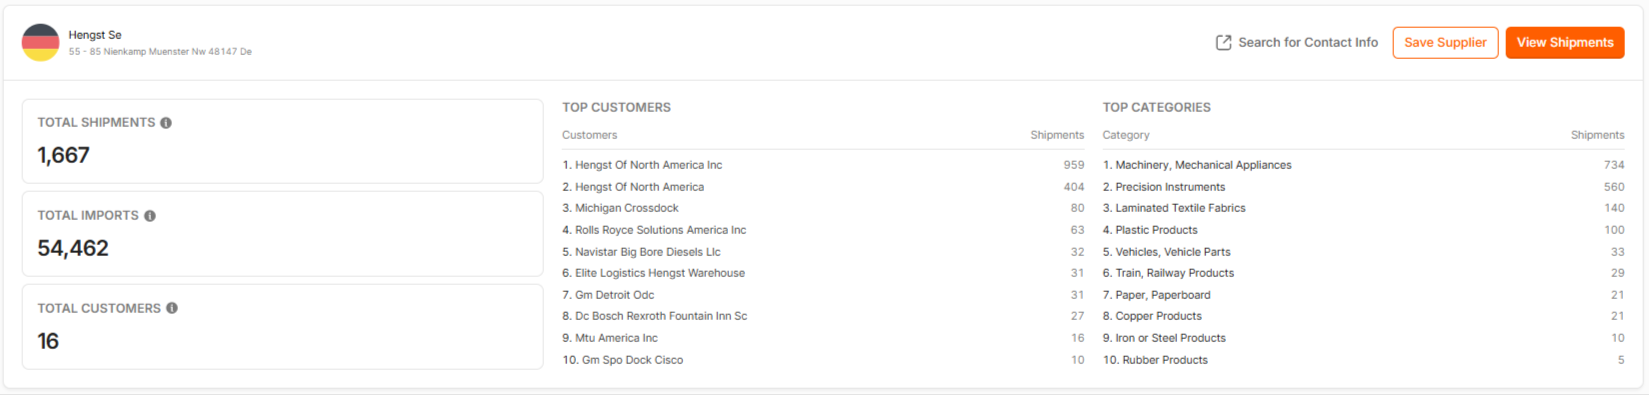
The Supplier Database is one of Jungle Scout's standout features. It gives you access to import records for a reported 98% of Amazon sellers. You can search by product, brand, or supplier name and see exactly which manufacturers are supplying which products, along with shipment volumes, pricing, and the identity of top US customers.
This level of sourcing intelligence is invaluable for sellers who want to verify a supplier's legitimacy before placing orders. No other mainstream Amazon tool provides this depth of supplier intelligence within its standard plans.
Our Verdict: Jungle Scout wins convincingly. The Supplier Database is a genuine competitive advantage that goes far beyond Helium 10's Alibaba-only extension. For any seller who sources products from manufacturers, this single feature can justify the Jungle Scout subscription.
6. Brand and Market Intelligence
This is where both Helium 10 and Jungle Scout share a significant blind spot.
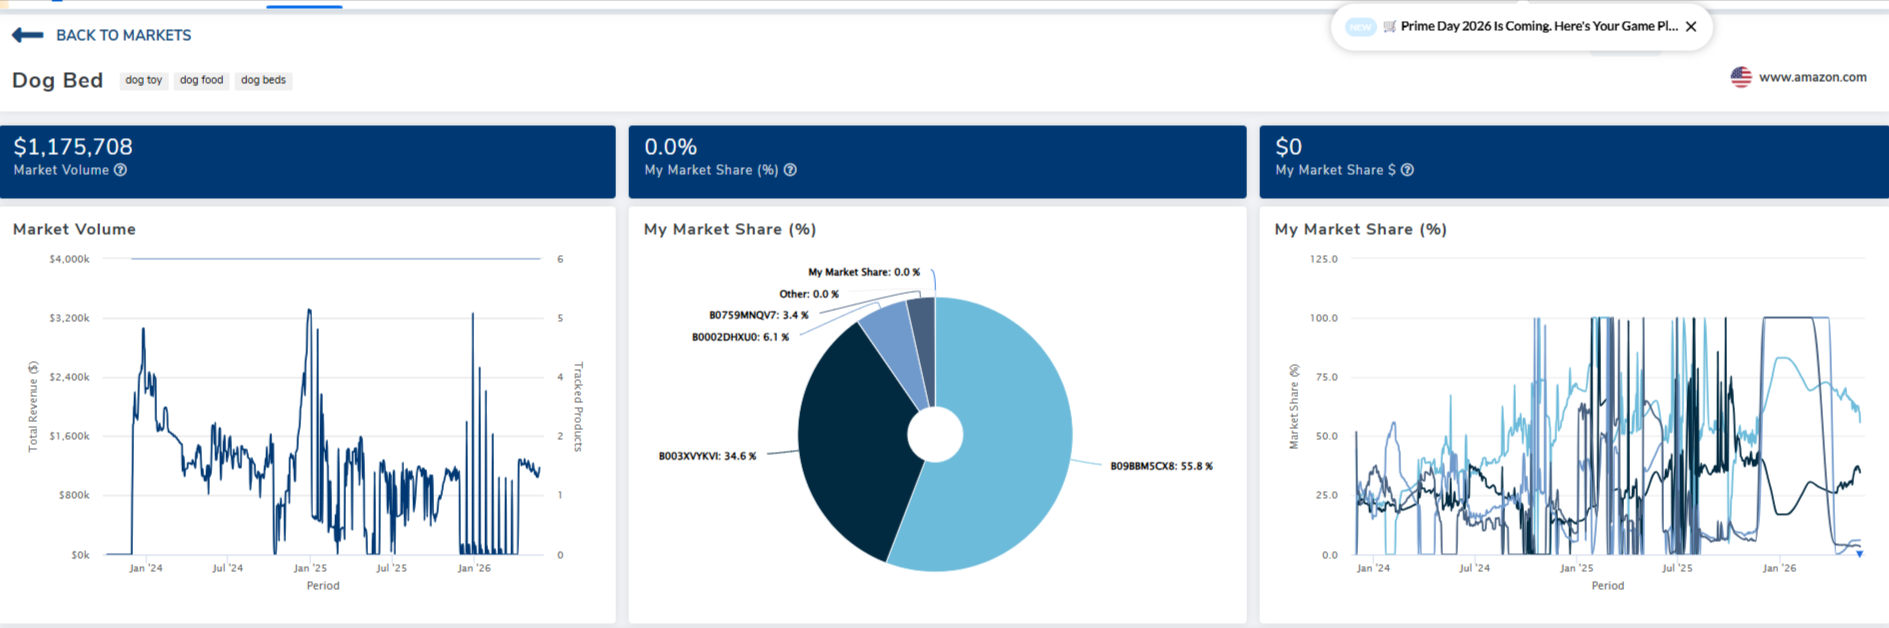
Helium 10's Market Tracker monitors competitor ASINs and tracks market share changes at the product level.
It is useful for keeping an eye on specific competitors, but it does not provide brand-wide revenue estimates, seller dynamics, or category-level competitive intelligence.
Jungle Scout's Brand Owner + CI plan ($149/month) includes competitive benchmarking and market share analysis.
Cobalt takes this further with enterprise-level intelligence. But even at these higher tiers, neither tool maps entire brand ecosystems, provides a proprietary brand health score, or visualizes how customer traffic flows between related products.
For wholesale buyers deciding which brands to approach, online arbitrage sellers evaluating seller density, or agencies pitching potential clients, product-level data alone is not enough. You need to understand brand-level dynamics: revenue distribution, seller count trends, Amazon's own in-stock rate, and competitive positioning across subcategories.
This is SmartScout's core strength. The Brand Database lets you filter through 1.5 million+ Amazon brands using 30+ parameters. The Traffic Graph visualizes how customer traffic flows between products. The Seller Map shows you exactly where Amazon sellers are located, what they sell, and how much revenue they generate. No other Amazon tool, including Helium 10 and Jungle Scout, provides this level of market intelligence. Explore the full Amazon software comparison to see where each tool fits.
7. Review Automation
Jungle Scout includes automated review request functionality on Growth Accelerator plans and above. You can set up automated requests that follow Amazon's Terms of Service, helping you build social proof faster without manual effort.
Helium 10 does not have a built-in review automation tool. Sellers using Helium 10 need to request reviews manually through Seller Central or use a third-party service, which adds cost and complexity.
Our Verdict: Jungle Scout wins. Review automation is a core operational feature for Amazon sellers, and having it built into the platform saves both time and money. The absence of this feature in Helium 10 is a notable gap.
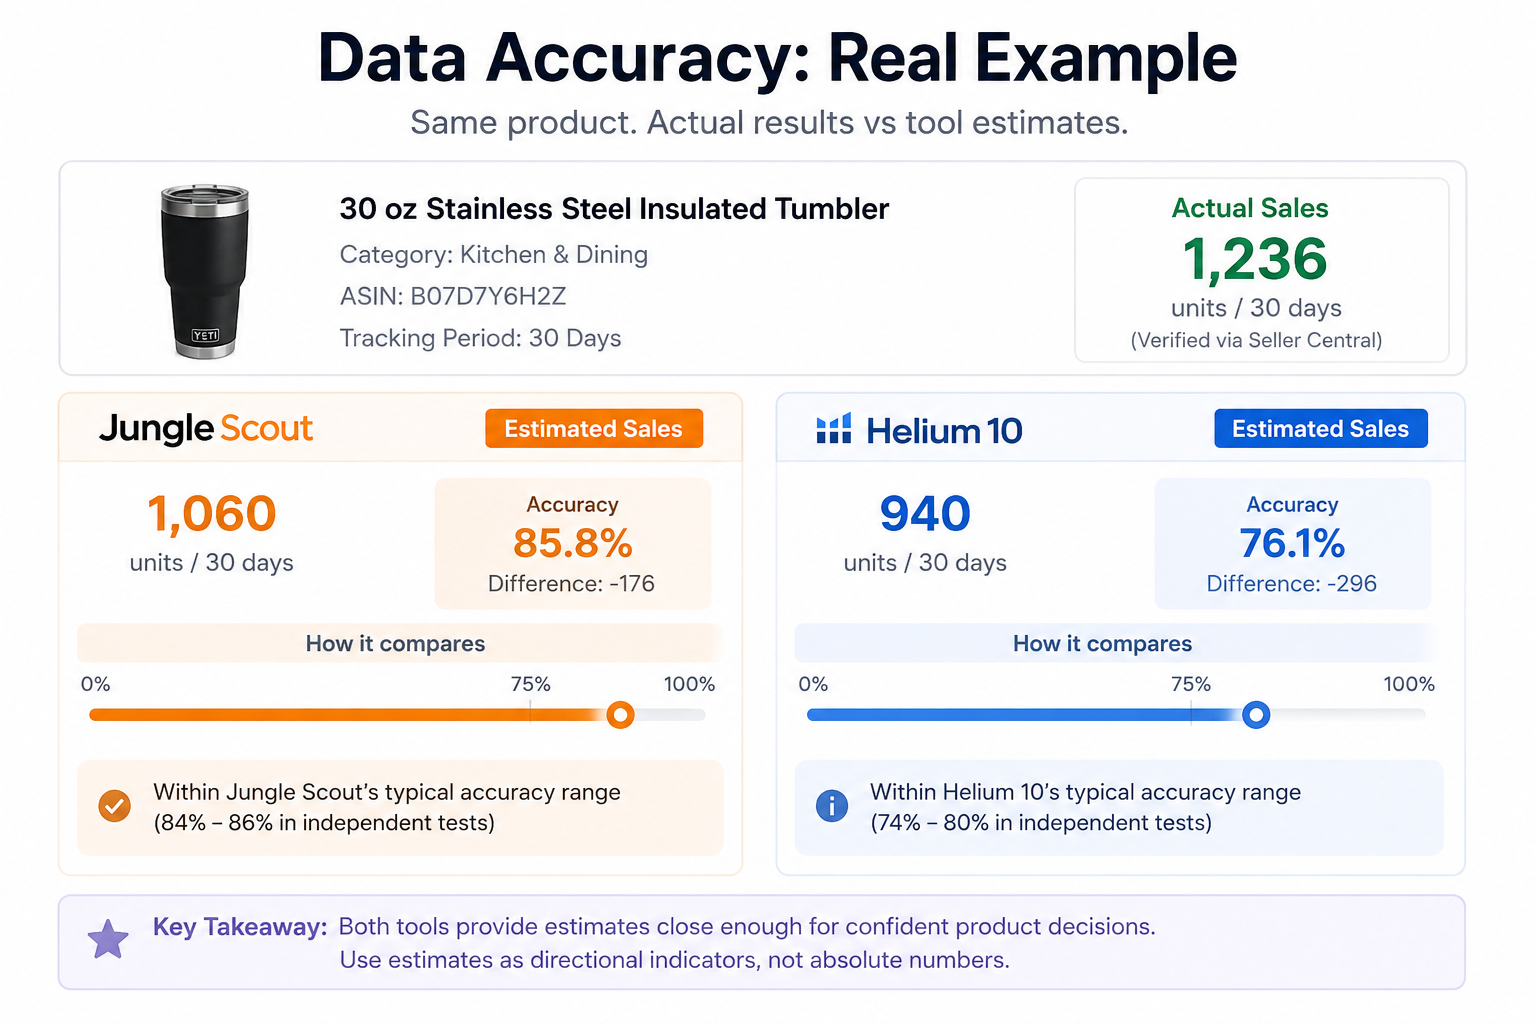
8. Data Accuracy
Accuracy is the most debated topic in every Helium 10 vs Jungle Scout comparison, and both platforms claim to be the most accurate. Here is what the independent testing actually shows.
Jungle Scout's own study claims 84% accuracy in sales estimation, placing itself first among all Amazon tools. Independent reviewers have largely confirmed this range, with most tests landing between 84% and 86%. Jungle Scout's 11 years of historical data and variation-level tracking contribute to consistently reliable estimates.
Helium 10's accuracy is more contested. Helium 10's own research claims 93.5% accuracy for normalized keyword search volume. Independent testers report sales estimation accuracy between 74% and 80%, depending on the product category and testing methodology.
The reality is that both tools provide estimates sufficient for product validation and business decisions. Neither is perfectly accurate, and treating any tool's estimates as gospel is a mistake. The smarter approach is to use estimates as directional indicators and validate with real sales data.
Our Verdict: Jungle Scout has a slight edge in overall sales estimation accuracy based on the weight of independent testing. Helium 10 has an edge in keyword search volume precision. In practice, both are reliable enough that accuracy alone should not be your deciding factor.
Related: SmartScout publishes transparent accuracy data. See how their estimates compare in the SmartScout Accuracy report.
9. Chrome Extension
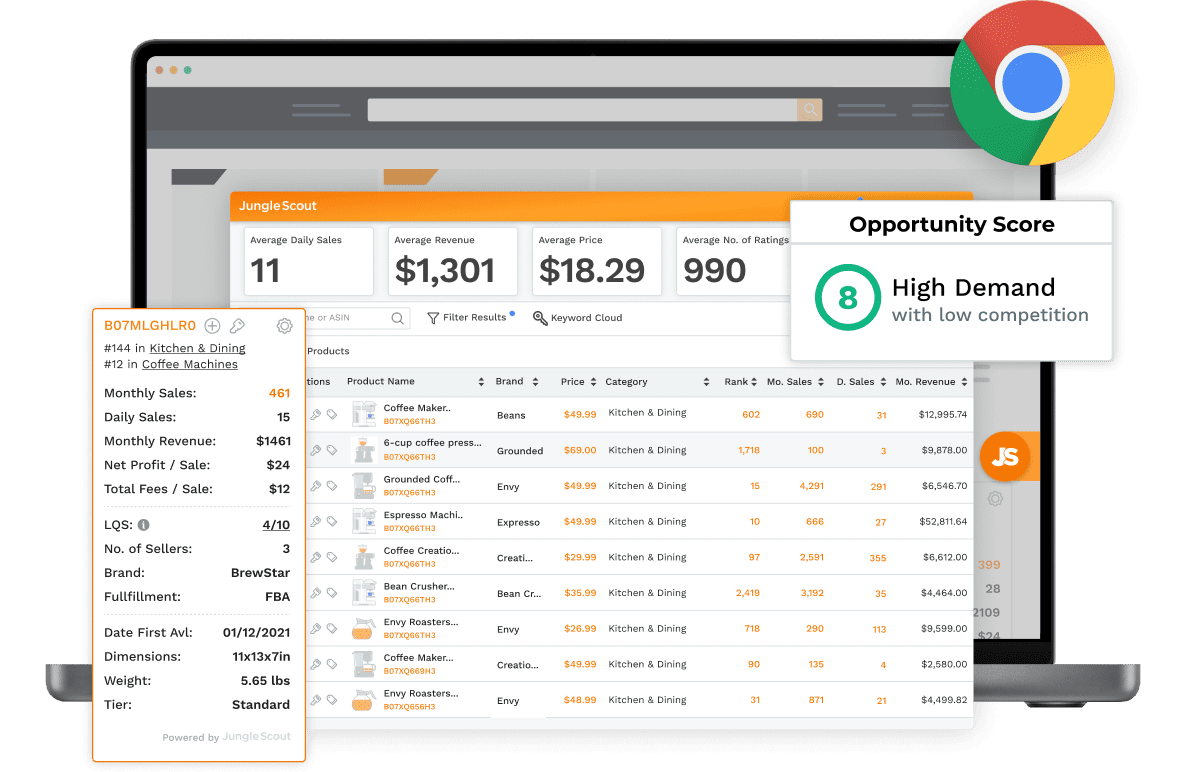
Jungle Scout's Chrome Extension is available as a free standalone tool with limited functionality and as a full version included with all Catalyst plans.
It works on both Chrome and Firefox browsers. The extension provides sales estimates, BSR data, revenue figures, and basic competitive metrics directly on Amazon product pages.
Helium 10's Xray Chrome Extension is included with paid plans and provides more data points per product: estimated net profit, inventory stock levels, exact star rating breakdowns, and supplier lookup. However, it only works on Chrome.
Our Verdict: Tie with different strengths. Jungle Scout wins on browser compatibility (Chrome + Firefox) and free access. Helium 10 wins on data density per product page.
Worth noting: SmartScout also offers a free Chrome extension with 1,000 uses per month. It includes an FBA calculator with 2026 fee rates, BSR tracking, seller analytics, and a product opportunity score. No subscription required.
10. AI Tools
Both platforms invested heavily in AI features throughout 2025 and into 2026.
Helium 10 integrates ChatGPT into its Listing Builder and offers an AI-powered chat assistant within the dashboard. The AI also powers parts of Adtomic's bid optimization engine.
Jungle Scout's AI Assist covers four areas: sales analytics (automated performance insights), review analysis (customer sentiment extraction), listing building (SEO-optimized copy generation), and an always-on Q&A chat.
The integration is tighter across the platform, with AI recommendations surfacing naturally within each tool's workflow.
Our Verdict: Jungle Scout has a slight edge. AI Assist is more deeply integrated across the platform and covers more functional areas (especially review sentiment analysis and sales analytics). Helium 10's ChatGPT-powered listing builder is strong, but its AI features feel more bolted-on than natively integrated.
11. Customer Support and Training
Customer support quality has become a real differentiator between these two platforms in 2026.
Jungle Scout holds a 4.2 rating on Trustpilot with over 3,900 reviews. Users consistently praise the responsive live chat, helpful email support, and the quality of the Jungle Scout Academy training modules. The company responds to 92% of negative reviews within a week.
Helium 10's Trustpilot ratings are around 2.3, with the most recent scores trending lower. Common complaints include difficulty canceling subscriptions, being charged after cancellation, and slow support response times.
The Selling Guys, a well-known Amazon seller review site, reduced their Helium 10 rating from 4.8 to 4.3 in early 2026 specifically due to customer service issues and price increases. The Freedom Ticket course by Kevin King remains excellent, but it does not offset the operational support issues.
Our Verdict: Jungle Scout wins clearly. The gap in user satisfaction scores is too large to ignore. Helium 10's Freedom Ticket is a valuable training resource, but customer support quality matters when you are paying $129 to $359 per month and encounter issues.
Pricing changed significantly for both tools in 2026. Here is what you actually pay today.
Helium 10 Plans
Plan
Monthly
Annual (per month)
Platinum
$129/mo
$99/mo
Diamond
$359/mo
$279/mo
Enterprise
Custom
Custom
Helium 10 also offers a free plan with heavily restricted access. The Starter plan ($39 to $49/month) was retired in early 2026 for new users. Adtomic's full PPC automation requires the Diamond plan. A 2% ad management fee applies on top of the subscription for PPC spend managed through the platform.
Jungle Scout Catalyst Plans
Plan
Monthly
Annual (per month)
Starter
$49/mo
$29/mo
Growth Accelerator
$79/mo
$49/mo
Brand Owner + CI
$149/mo
$129/mo
Cobalt (Enterprise)
Custom
Custom
All Catalyst plans include a 7-day money-back guarantee. The Growth Accelerator plan is widely considered the best value, unlocking the Supplier Database, Review Automation, Inventory Manager, and Advertising Analytics at $79/month (or $49/month billed annually).
Our Verdict: Jungle Scout is significantly more affordable at every tier. Jungle Scout's Growth Accelerator at $49/month (annual) includes features that Helium 10 locks behind the $279/month Diamond plan. Even Jungle Scout's top-tier Brand Owner + CI plan ($129/month annual) costs less than Helium 10's entry-level Platinum at $129/month.
Budget tip: SmartScout's Basic plan starts at $29/month, and the Essentials plan ($97/month) includes brand analytics, Seller Map, and Traffic Graph. A seller running SmartScout Essentials ($75/month annual) and Jungle Scout Growth Accelerator ($49/month annual) pays just $124/month total, which is less than Helium 10 Platinum alone. That combination gives you market intelligence, product research, supplier sourcing, and review automation. See SmartScout pricing for full plan details.
By this point, the pattern should be clear: neither platform is objectively better than the other. Helium 10 offers greater depth, automation, and marketplace coverage, while Jungle Scout prioritizes simplicity, affordability, and product discovery. Here's a quick look at where each platform shines and where it falls short.
Pros and Cons of Helium 10
Pros
Industry-leading keyword research with Cerebro and Magnet
Advanced PPC automation through Adtomic
Supports Amazon, Walmart, and TikTok Shop
Extensive suite of tools for scaling businesses
Includes Freedom Ticket training for paid users
Cons
Significantly more expensive than Jungle Scout
Steeper learning curve due to the large number of tools
Some advanced features require higher-tier plans
Customer support receives mixed reviews from users
Limited supplier intelligence compared to Jungle Scout
Pros and Cons of Jungle Scout
Pros
Beginner-friendly interface and workflows
Strong product research and validation tools
Best-in-class Supplier Database
Built-in review automation and inventory management
More affordable pricing across all tiers
Cons
Less advanced keyword research than Helium 10
PPC tools focus more on analytics than automation
Amazon-focused with no Walmart or TikTok Shop support
Fewer advanced optimization features for large sellers
Limited competitive intelligence compared to specialized Amazon research platforms
Can You Use Helium 10 and Jungle Scout Together?
Some sellers run both tools simultaneously, and it is not as redundant as it sounds.
The strongest case for using both is pairing Jungle Scout's Supplier Database and Review Automation with Helium 10's Cerebro keyword research and Adtomic PPC automation. Jungle Scout handles the product discovery and sourcing phase, while Helium 10 handles the optimization and advertising phase.
The combined cost of Jungle Scout Growth Accelerator ($49/month annual) and Helium 10 Platinum ($99/month annual) comes to $148/month. That is still less than Helium 10 Diamond alone ($279/month annual), and you get supplier intelligence, review automation, and inventory management that Diamond does not include.
For most sellers, though, choosing one platform is the pragmatic move. Pick Jungle Scout if you are still in the product research and launch phase. Add Helium 10 when your business demands advanced keyword optimization and PPC automation at scale.
The Complete Amazon Seller Stack: Filling the Gaps
Helium 10 and Jungle Scout both excel at product-level operations (keyword research, listing optimization, PPC management, supplier sourcing), but neither provides the market intelligence layer that separates good product decisions from great ones.
Here’s what most sellers do:
Market intelligence (brand analytics, subcategory revenue, seller mapping, traffic flow) for deciding WHERE to compete
Product research and validation (product databases, keyword research, demand estimation) for deciding WHAT to sell
Operational optimization (listing SEO, PPC automation, review management, inventory tracking) for deciding HOW to sell better
Helium 10 and Jungle Scout both cover the second and third layers exceptionally well. They also offer limited market-level visibility through tools such as Market Tracker and Jungle Scout's Market Intelligence capabilities.
The distinction is that these features are primarily designed to monitor products and competitors you already know about. They are less focused on exploring entire categories, evaluating brand ecosystems, mapping seller networks, or identifying market opportunities before product research begins.
However, Helium 10’s market intelligence tool comes as an add-on, whereas Jungle Scout’s unlocks when you go for the highest-tier plan.
SmartScout fills the market intelligence gap at a lower cost. The Subcategories tool maps 40,000+ niches with revenue data. The Brand Database filters 1.5M+ brands by 30+ parameters. The Traffic Graph reveals product relationships and ad targeting opportunities. The Seller Map shows geographic seller distribution worldwide. And the Ad Spy exposes competitor advertising strategies. None of these capabilities exist in Helium 10 or Jungle Scout at any price tier. Book a free SmartScout demo to see how it complements your existing toolkit.
Conclusion: Jungle Scout for Getting Started, Helium 10 for Scaling Up
After testing both platforms extensively, the pattern is clear: these tools serve different stages of the Amazon selling journey.
Jungle Scout Catalyst is the stronger choice for sellers who are finding products, validating demand, sourcing suppliers, launching listings, and building review momentum. The Opportunity Finder, Supplier Database, and Review Automation create a cohesive workflow that takes you from idea to live product with minimal friction. The pricing is fair, the interface is clean, and the customer support is consistently excellent.
Helium 10 is the stronger choice for sellers who have established products and want to maximize their performance. Cerebro's keyword depth, Adtomic's PPC automation, and the multi-marketplace support (Amazon + Walmart + TikTok Shop) give scaling sellers tools that Jungle Scout does not match. The pricing is steep, the learning curve is real, and the support could be better, but the raw capability is undeniable.
If budget forces a single choice: pick Jungle Scout if you are a beginner want to scale on Amazon, and consider Helium 10 when you are a high-end seller and need deeper optimization firepower.
SmartScout offers the capability of both Helium 10 and Jungle Scout at a fraction of the cost. Additionally, you get exceptional features like AI Listing Architect, Traffic Graph, Seller Map, and access to 40K categories, at a starting price of $29/month. New users can start with a risk-free 7-day money-back guarantee.