That’s right, we’re heading on to greener pastas. (Who writes these things? Oh right, it’s a me!)
Sorry, I just really need some Italian food. I’ll be right back.
Ok, back to business. In all seriousness, we’re very excited to be offering a new marketplace to our subscribers. It’s not the largest market in Europe, that would be Germany, but it is by far the most popular online store in Italy.
As you can see, it’s almost 6 times bigger than the next largest retailer. If you want success in Italy, you have to be on Amazon.
Here Are Some More Facts About the Market You Should Keep Handy:
Market Size - $2.9 billion in 2019. If growth in 2020 was consistent with the rest of Amazon, sales were around $4 billion last year.
Prime Membership - Italy is believed to have between 1.5 and 2 million Prime members.
Seller Size - Amazon as a seller is more dominant in Italy than in America, making it even more critical to choose subcategories and products that Amazon is not involved in if you want to find success.
Should You Be Selling in Amazon.it?
Anyone who sells consumer goods in Italy should be on Amazon. It’s by far the main place for online shopping.
What about everyone else? If you’re already in Europe and you’re familiar with how to operate in other countries, go for it.
For first timers, you’ve got a bit to think about. Any time you’re moving into a new country, you’ll have to research what exactly is required for importing — every country has its own rules on taxes and compliance. Amazon makes a lot of things simple with its massive FBA infrastructure, as well as local customer support. You can learn about some of the ways Amazon will help you sell abroad here.
However, given the work you’ll have to go through every time you get started in a new country, it’s generally advisable to start with the biggest markets and work your way down. The United States is by far the biggest, but the UK and Germany are nothing to scoff at.
An American’s first expansion should be into Canada or the UK (Canada for having the fewest cultural differences, the UK for being a bigger market). Once you understand the process of adapting to a new country, keep working your way down to the next biggest markets.
Italy is a slightly smaller market than Canada, so a successful seller can expect to have perhaps 75 percent of the revenue a Canadian operation produces. Is that worth it? That’s entirely up to you. What will certainly help along the way is knowing which categories, subcategories, brands, and products are underrepresented.
Find out which products are those with SmartScout!
New SmartScout data shows that nearly half of all Apple laptops sold on Amazon US now ship with 8GB of memory. The AI memory squeeze is reaching consumers two different ways, and only one of them shows up on the price tag.
A Reversal, in the Company’s Own Product Line
In late October 2024, Apple made 16GB the standard memory configuration across every Mac it sold. The move was widely read as preparation for Apple Intelligence, which needed more memory than the old 8GB baseline could spare. Apple did it without raising prices. For the first time in the company's history, the entry-level Mac and the expensive one had the same amount of memory.
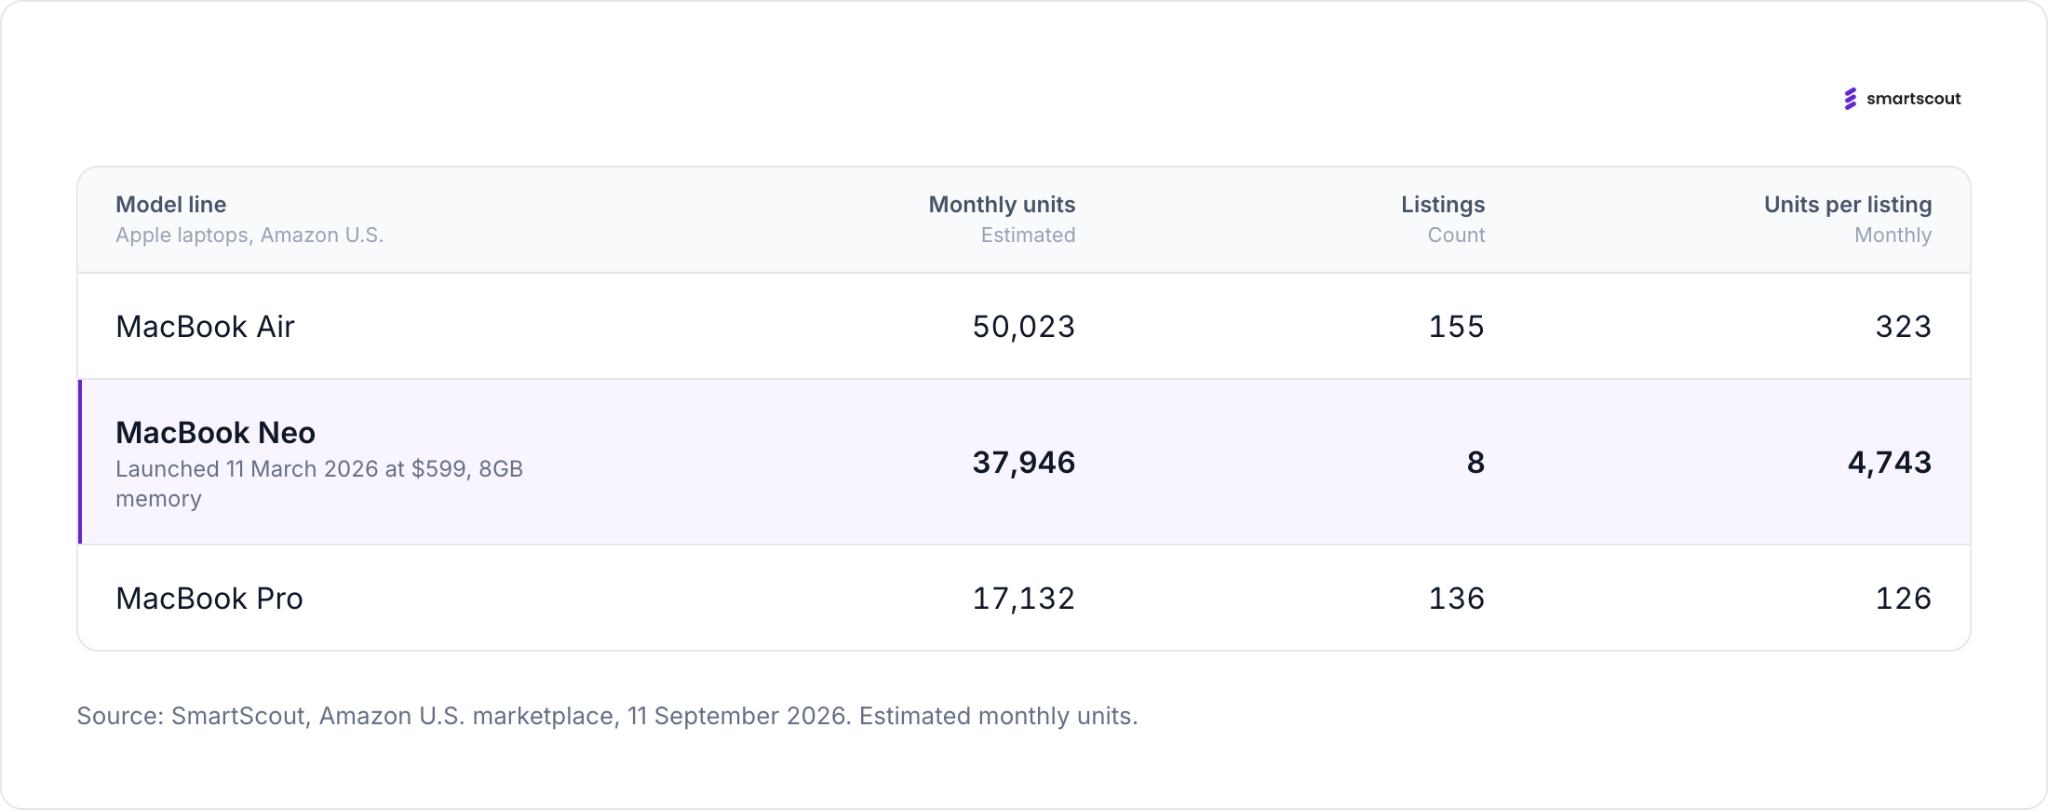
On 11 March 2026, Apple launched the MacBook Neo at $599. It has 8GB of memory, a 256GB drive, and an A18 Pro chip, the processor from the iPhone 16 Pro. Apple markets it as built for artificial intelligence.
Sixteen months separate those two decisions. In between, data centre demand for memory chips repriced the entire supply chain.
Almost Half of Apple’s Amazon Laptop Volume Is Now 8GB
SmartScout tracked 300 Apple laptop listings in the Amazon US Traditional Laptops subcategory, accounting for $114,945,776 in monthly revenue and 105,142 units.
Sorted by the memory configuration stated in each listing, 45.6 percent of units now ship with 8GB. Another 39.4 percent ship with 16GB. Configurations of 32GB and above account for 2.4 percent of units between them.
The MacBook Neo is doing that on its own. It generates $27,742,797 a month, 24.1 percent of Apple's Amazon laptop revenue and 36.1 percent of its units, from eight listings. The MacBook Air needs 155 listings to produce 47.6 percent of units. The best-selling single MacBook Neo configuration moves 8,169 units a month against 6,348 for the best-selling MacBook Air.
A machine that did not exist in February is now a third of Apple's laptop volume on the largest retail channel in the United States.
Two Ways To Send a Shopper the Bill
Every device maker facing higher memory costs has two levers. Raise the price, or reduce what goes in the box. Which lever a company pulls depends on whether it has a configuration to cut and a margin to protect.
Laptop makers have both. A laptop has a memory tier, a storage tier and a processor tier, and the maker can move any of them without changing the name on the lid. So laptop revenue on Amazon US grew 19 percent year over year, a modest figure against the 162 percent increase in the Computer Memory aisle. The adjustment happened inside the specification instead.
Console makers have neither. A PlayStation 5 is a PlayStation 5. There is no 8GB version to sell instead, and consoles carry thin hardware margins by design because the money is made on software. Microsoft said as much when it raised Xbox prices by as much as $150, stating that storage and memory costs had more than doubled since the previous autumn and that consoles are not sold with enough margin to absorb that.
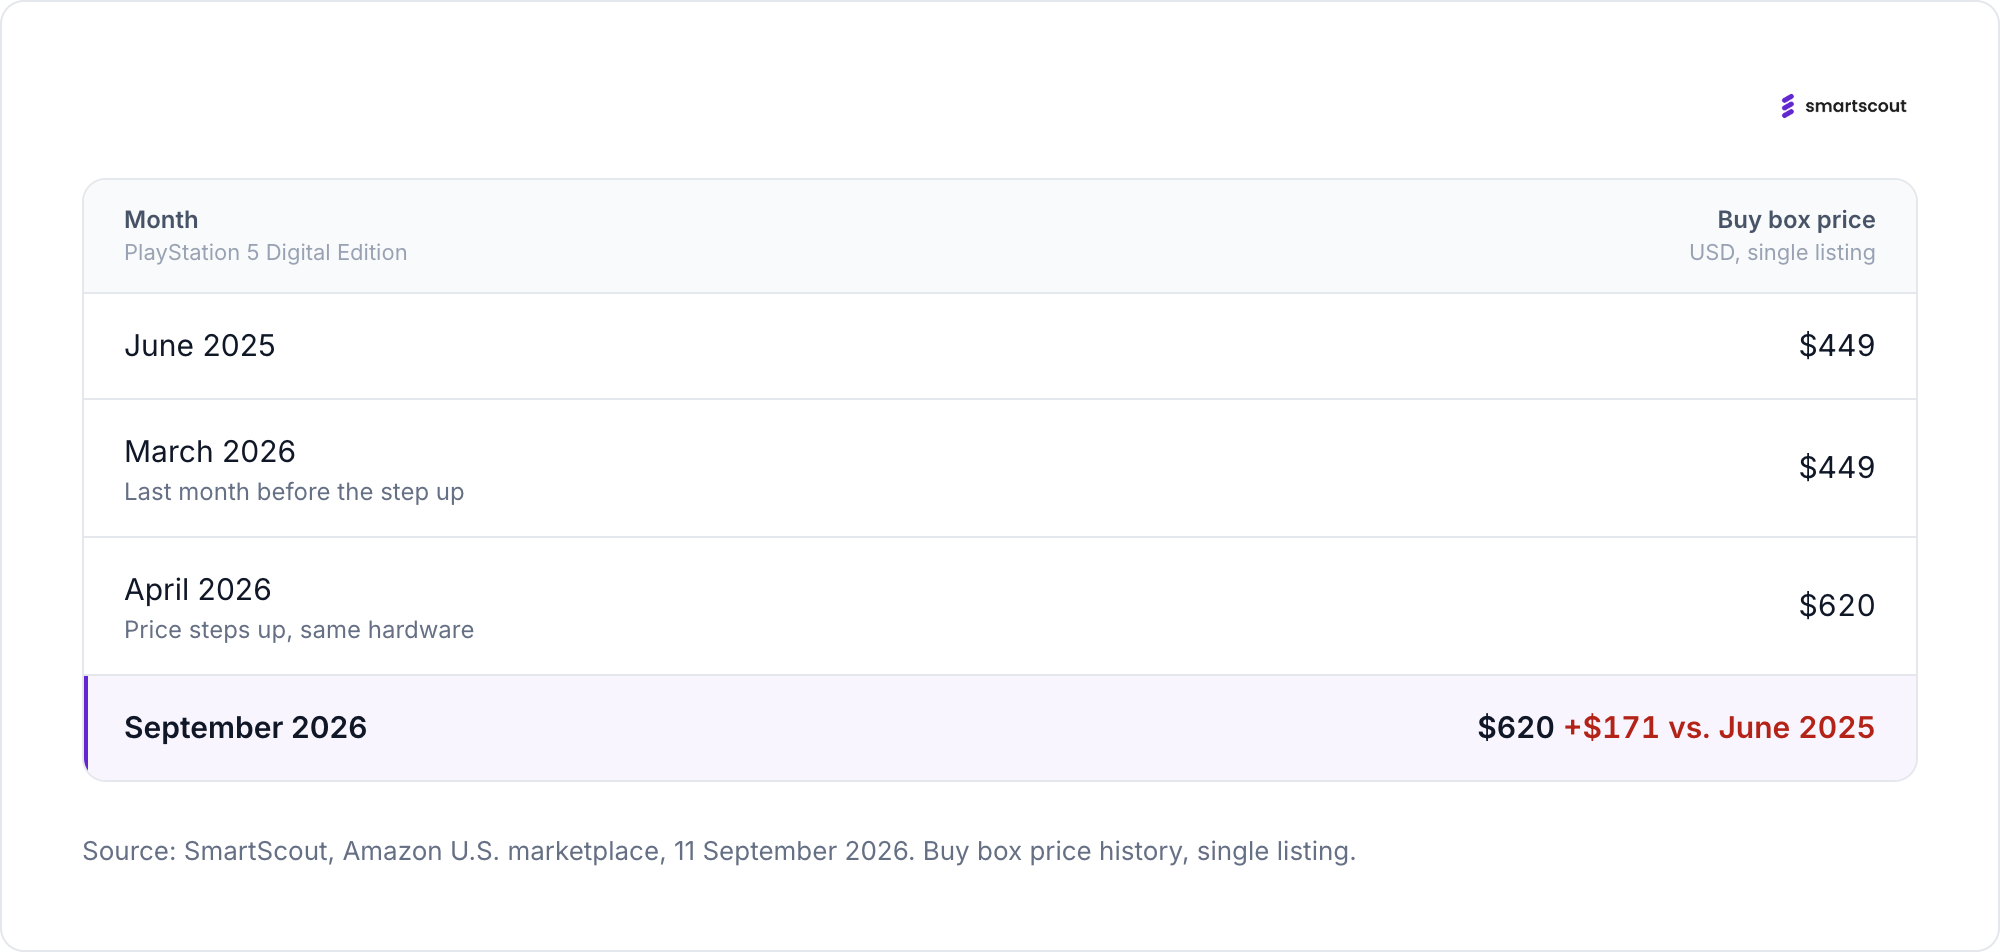
The result is visible in the price history. A PlayStation 5 Digital Edition held a buy box price of $448.50 in June 2025 and $499 from September through March. In April 2026 it stepped to $598. By August it averaged $623. The machine did not change. PlayStation 5 console revenue on Amazon is up 56 percent year over year, and Xbox Series X and S revenue is up the same 56 percent.
A console buyer pays more for the same machine. A laptop buyer pays a little more for a smaller machine. Both are paying the memory bill. Only one of them can read it off the shelf.
The Further a Category Sits From a Memory Chip, the Less It Moves
Ranking Amazon US categories by year-over-year revenue growth produces an unusually clean gradient.
Where the memory chip is the product, prices rose hardest: Computer Memory up 162 percent, external solid state drives up 90 percent, memory cards up 64 percent, internal solid state drives up 63 percent, flash drives up 35 percent. The Data Storage department as a whole is up 91 percent.
Where memory is a large share of the bill of materials, the increase is real but smaller: consoles up 56 percent, graphics cards up 41 percent, laptops up 19 percent, tablets up 17 percent, processors up 11 percent.
Where a product contains little or no memory, nothing happened, or the category shrank: computer monitors up 14 percent, networking products up 9 percent, tablet accessories up 8 percent, power supplies flat, cooling down 10 percent, motherboards down 13 percent, optical drives down 24 percent.
Motherboards and power supplies are the tell. Those are the parts you buy at the same time as memory. Both categories are flat or falling while memory climbs, which is what happens when people stop building computers.
Shoppers Are Walking Down the Memory Ladder
Search behaviour on Amazon confirms that buyers are adjusting their own expectations rather than paying up.
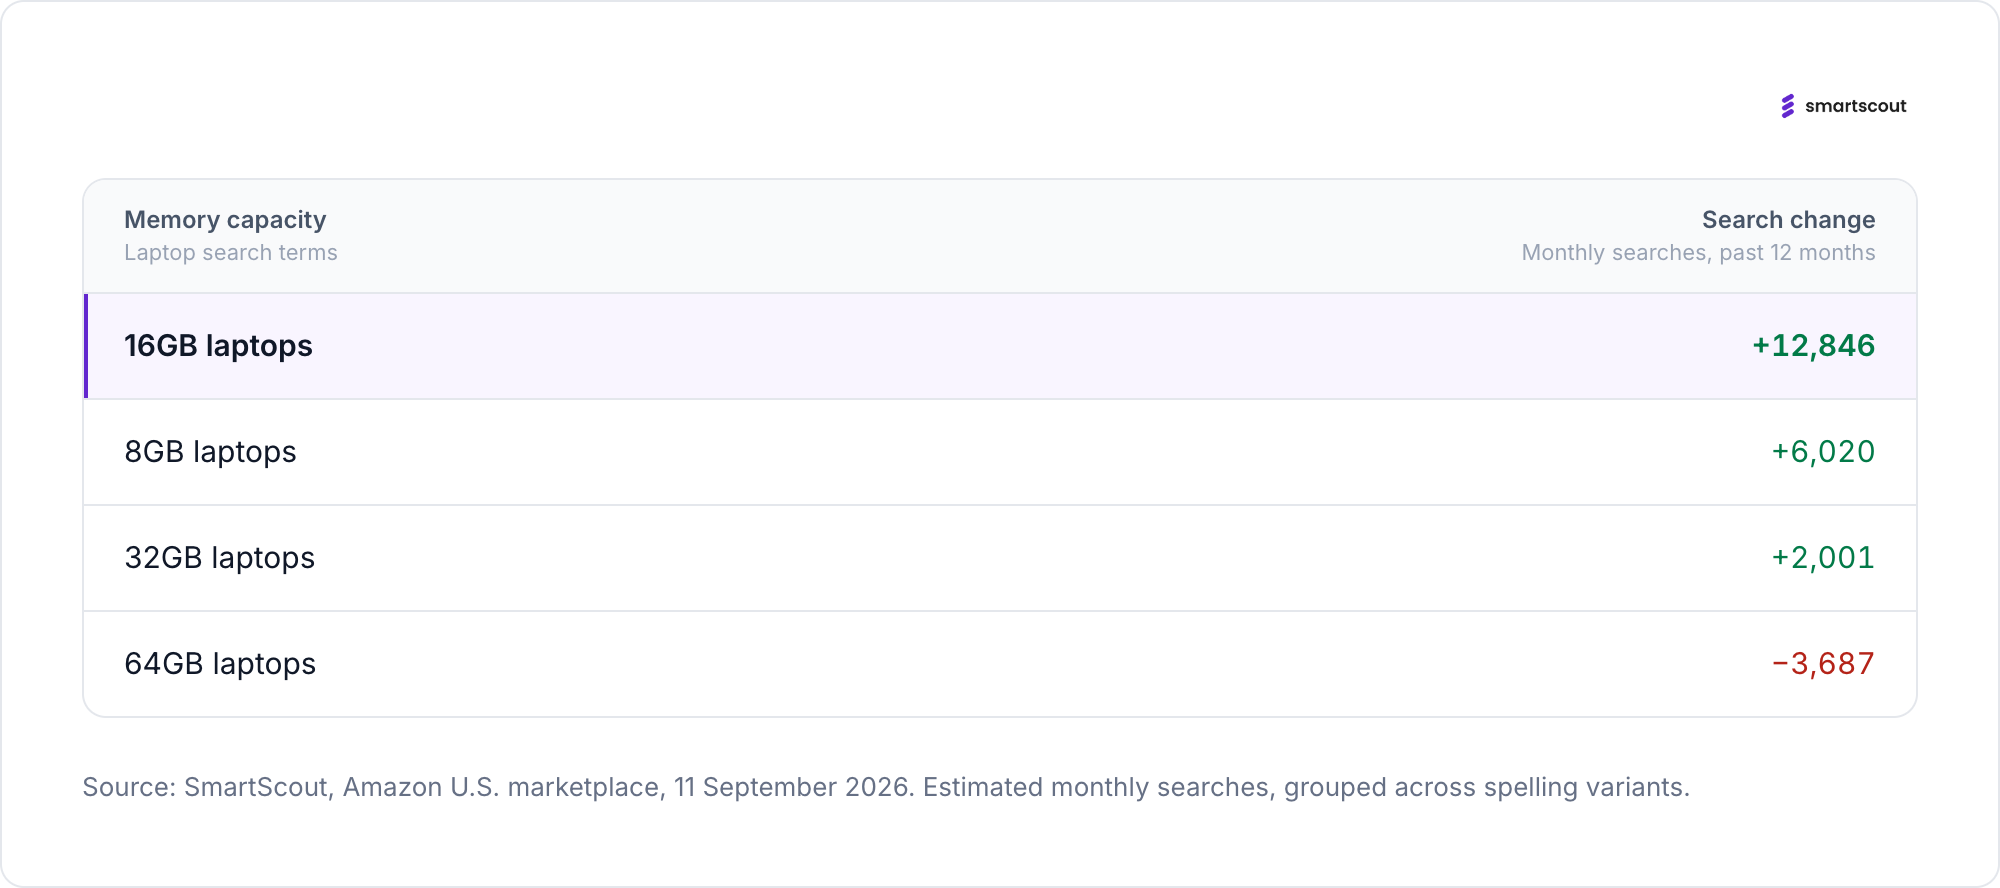
Grouping laptop memory searches by capacity, the bottom rungs are growing and the top rung is shrinking. Searches for 8GB laptops are up roughly 6,000 over twelve months and gained about 3,500 in the last month alone. Searches for 16GB laptops are up roughly 12,800. Searches for 32GB laptops are up about 2,000 and fell last month. Searches for 64GB laptops are down about 3,700 over the year.
The secondhand market is inflecting at the same time. Searches for refurbished laptops stand at 44,532 a month and have added 9,109 in the last three months after being flat for the year before. "Refurbished laptops clearance sale" has gone from almost nothing to 15,558 searches a month. "Certified refurbished laptops" and "refurbished laptop clearance" both appeared from a standing start in the last twelve months.
People are not cancelling the purchase. They are buying less computers, or buying somebody else's.
The Squeeze Is Consolidating the Market
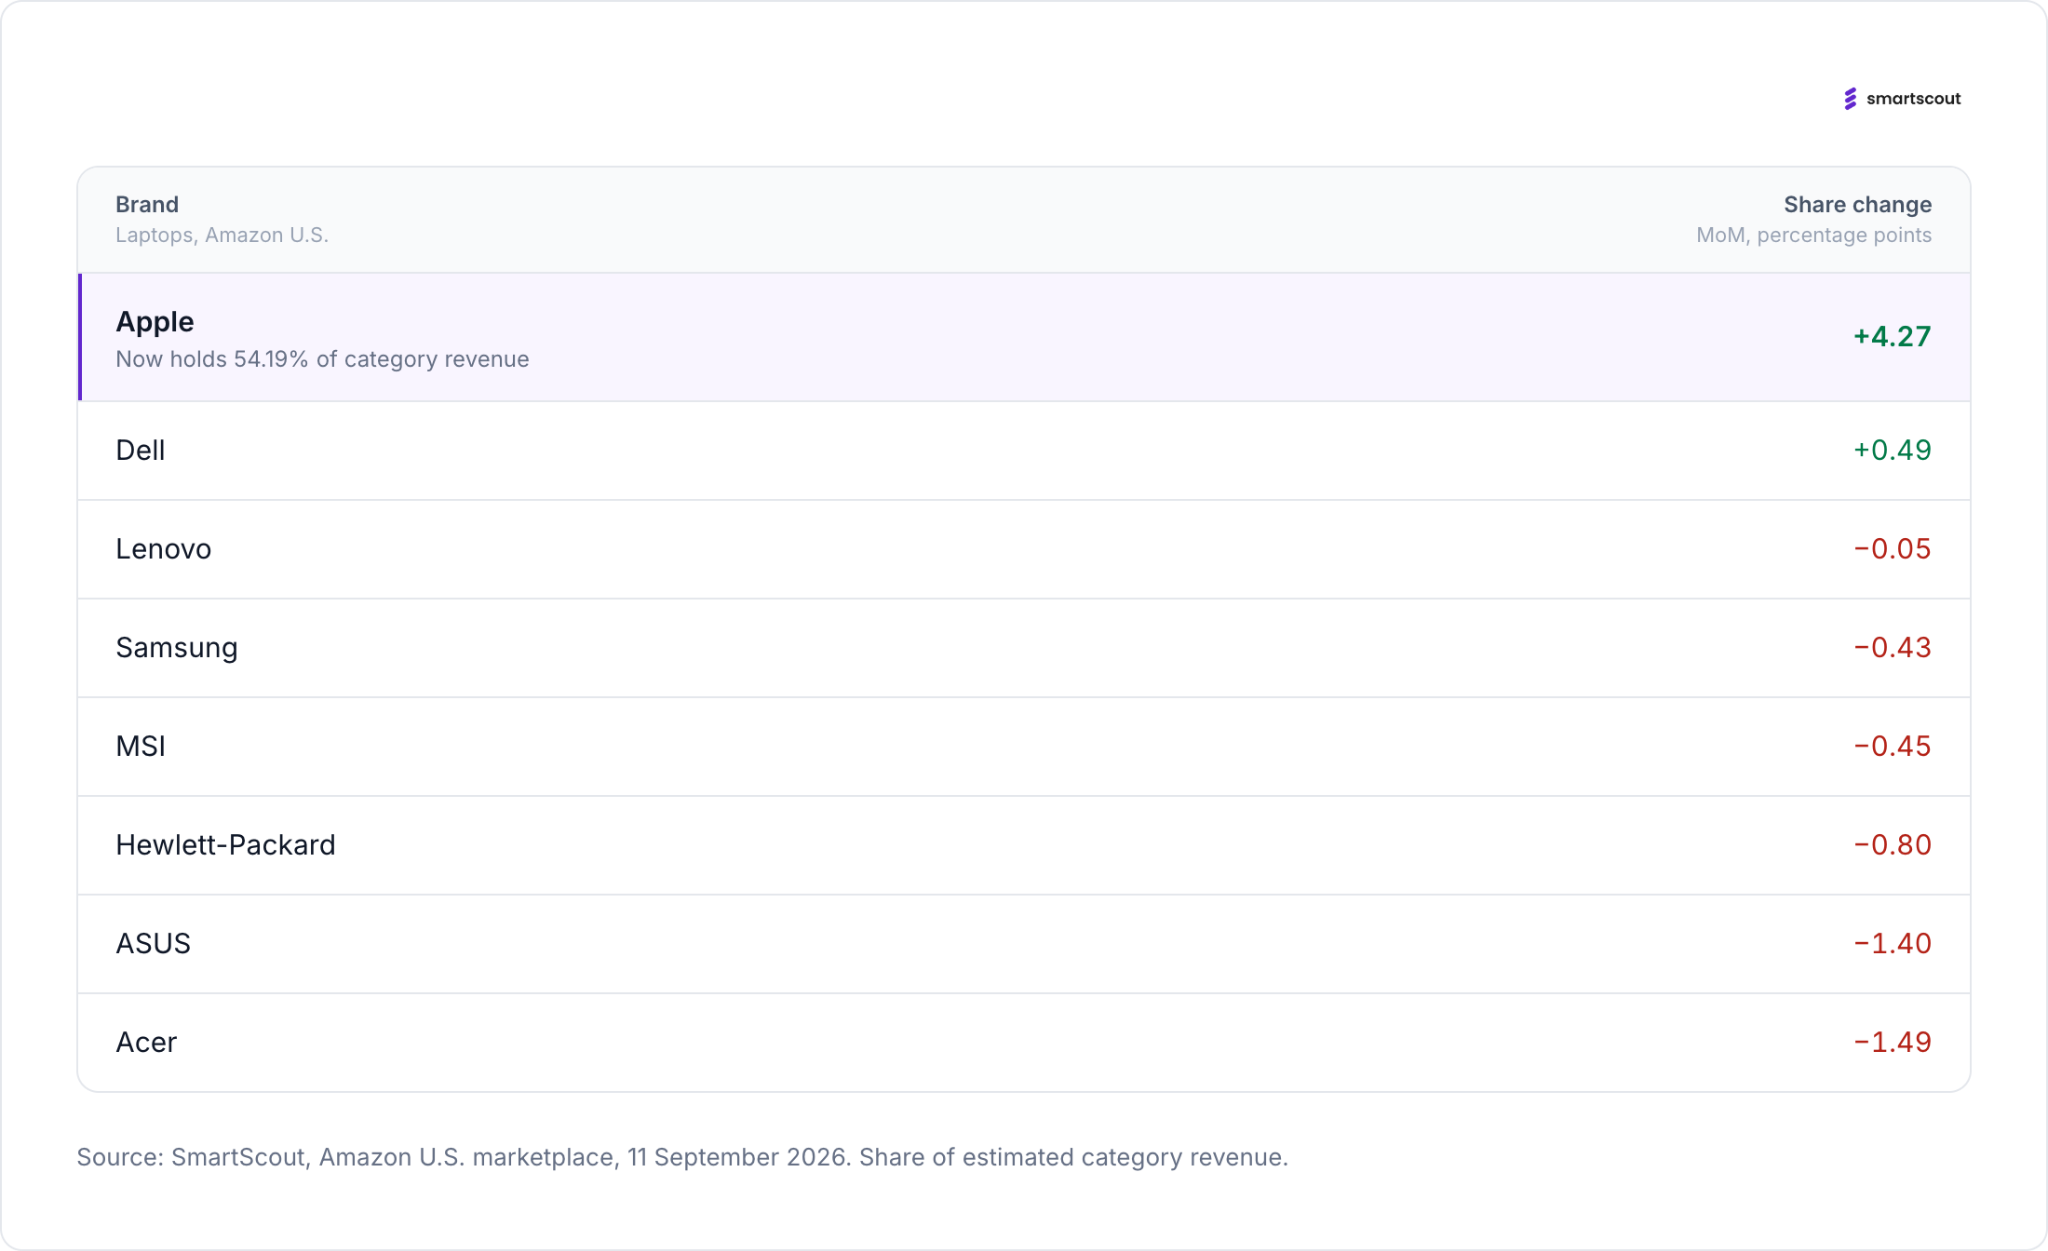
Apple now holds 54.19 percent of Amazon US laptop revenue, up 4.27 points month over month, and accounts for 50.6 percent of all advertising spend in the category. It gained that share in the same period it raised prices on Macs and iPads by as much as 25 percent, citing memory costs.
The brands that lost ground are the ones that buy memory and storage on the open market and sell into the enthusiast segment. Acer fell 1.49 points and lost 3,460 units. ASUS fell 1.40 points. Hewlett-Packard fell 0.80. MSI, whose average selling price of $2,520 is the highest of any volume brand in the category, fell 0.45 points and lost 594 units. Samsung fell 0.43 points and lost 3,211 units.
Component scarcity rewards whoever has the longest contracts and the most leverage with three suppliers. On Amazon, that is currently Apple.
Apple Retired the 8GB Mac Because of AI. Sixteen Months Later, AI Brought It Back.
Native Amazon reports are siloed and revenue-focused, which hides profit problems until they've already cost the client money.
Know the core terms cold: ACoS, TACoS, contribution margin per SKU, AMC, share of voice, and Buy Box.
2026 brought real platform shifts: Rufus retired into Alexa for Shopping, Sponsored Prompts became a billable placement, DSP thresholds dropped, and Prime Day moved to June.
Size your actual need before choosing a tool: account count, category expansion plans, time spent reformatting reports, and white label requirements.
Amazon analytics covers a lot of ground: sales data, ad performance, fee breakdowns, competitive intelligence, and increasingly, shopper behavior signals that never used to be visible at all. If your agency is new to the category or catching up after a year of platform changes, here's the context worth having before you pick a tool or promise a client anything.
Why Native Amazon Reports Fall Short
Seller Central and Amazon Ads give you plenty of reports, but they're built to show activity, not profit. Sales, advertising, fees, and refunds each live in a separate place, so by the time a margin problem shows up in a spreadsheet, it's already cost the client money. Native reporting is also revenue-focused by default, and revenue is not the same question as "which SKUs are actually making money after ads, fees, and refunds." That gap is the whole reason a separate analytics layer exists.
The Terms Worth Knowing
A quick glossary, since these terms get used loosely and clients will expect you to use them precisely.
Key Amazon Advertising Terms & Metrics
Term
What It Means
ACoS
Advertising Cost of Sale. Ad spend divided by ad-attributed sales only.
TACoS
Total Advertising Cost of Sale. Ad spend divided by total sales, ad and organic combined.
Contribution margin per SKU
Selling price minus product cost, referral fee, FBA fulfillment, and storage. The actual dollar profit per unit.
AMC
Amazon Marketing Cloud. Amazon's shopper-signal and path-to-purchase data layer.
Share of voice
A brand's visibility in a category relative to competitors, usually measured across organic and paid placements.
Buy Box
The default "Add to Cart" listing on a product page. Losing it is one of the fastest ways to lose sales without any ad metric changing.
What Changed on Amazon in 2026
A few platform shifts changed what "good analytics" needs to cover this year.
Amazon retired Rufus into Alexa for Shopping, Sponsored Prompts became a billable ad placement, DSP entry thresholds dropped, and Prime Day moved to June. The scale of the platform is also part of the picture: Amazon holds an estimated 39.7% of US ecommerce sales in 2026 by one measure, and 35.7% of a $440 billion base by another, depending on how the base is calculated.
Either way, the amount of shopper behavior data flowing through Amazon's own systems keeps growing, which is exactly why AI-powered search and generative shopping assistants are starting to influence purchase decisions before a click ever reaches a listing.
For agencies, the practical takeaway is that ad-placement reporting alone is falling further behind. A client asking "why did conversion drop" increasingly needs an answer that accounts for how Amazon's own AI assistants are surfacing (or not surfacing) their products, not just a bid-and-budget explanation.
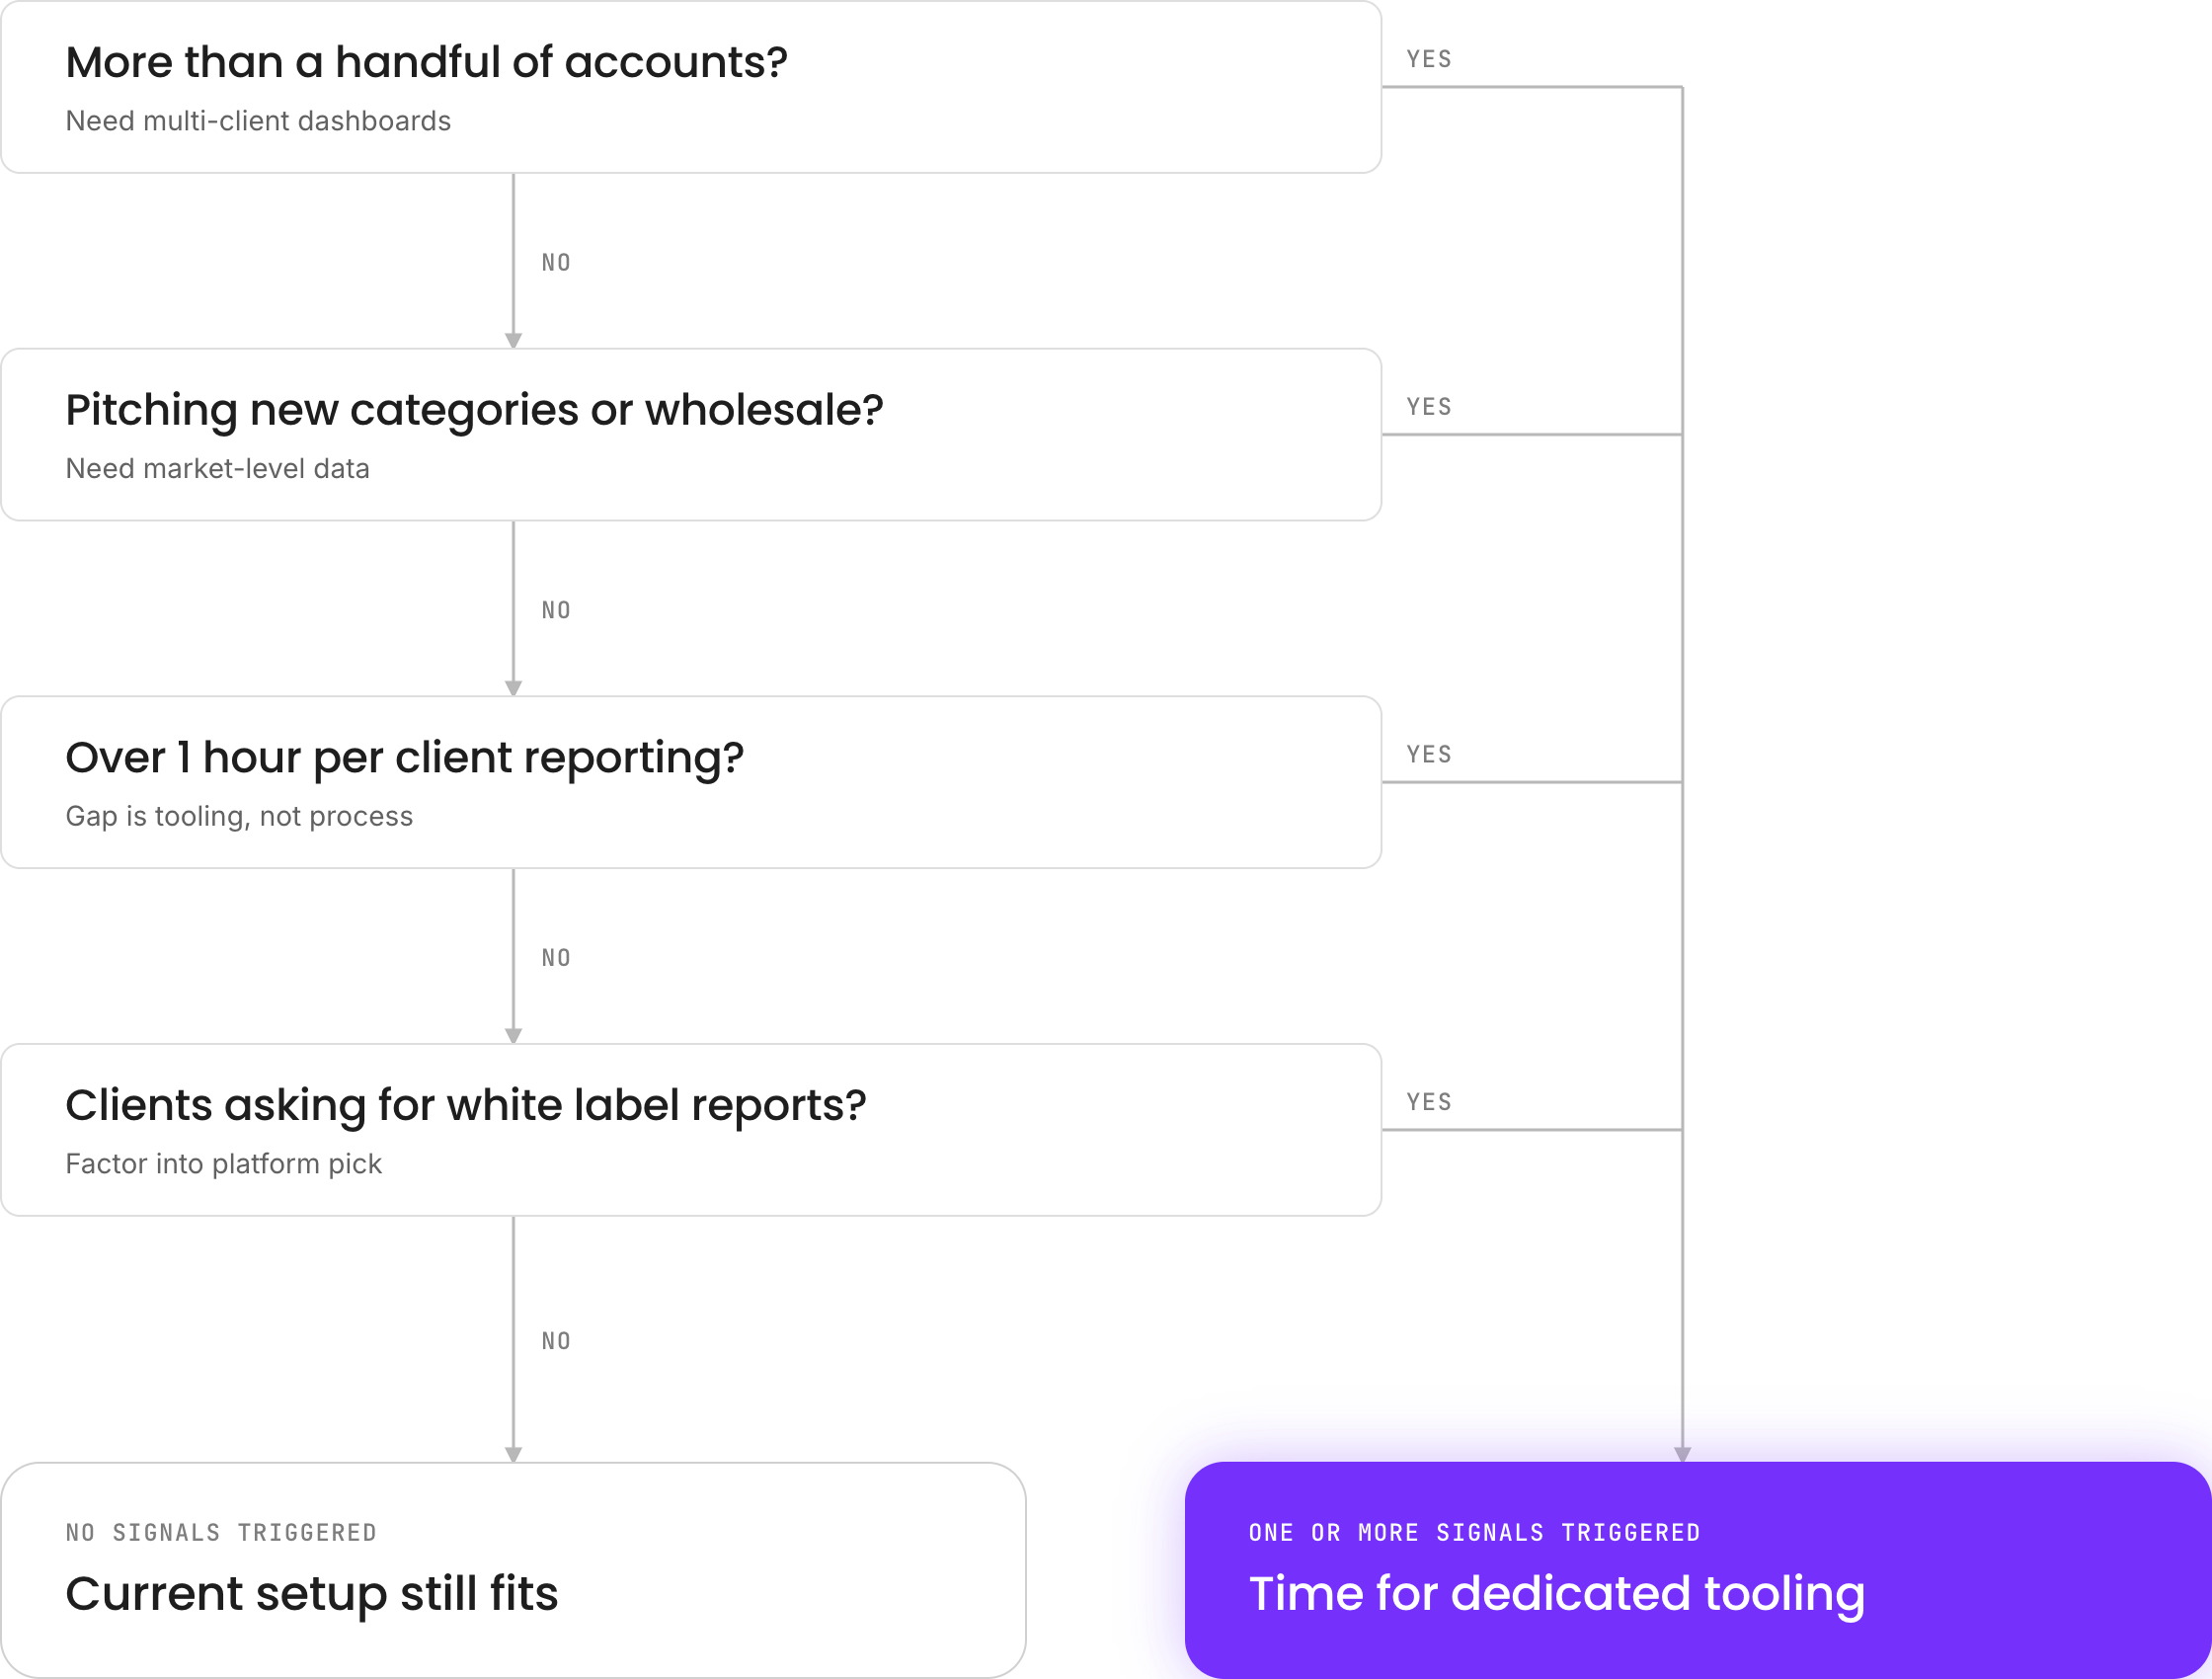
How to Know What Your Agency Actually Needs
Not every agency needs the same depth of tooling. A few honest questions help:
Once you know the answer to those, the tool decision gets a lot easier.
Connect five data buckets before building any dashboard: advertising, retail, shopper intelligence, competitive intelligence, and client-specific data.
Report TACoS and contribution margin per SKU together. TACoS alone can look healthy while margin quietly disappears.
A healthy account-level TACoS runs 10-15% of revenue for an established seller; new launches run 25-40% in the first one to three months.
Set cadence by metric: daily for Buy Box and stock, weekly for ACoS, monthly for TACoS, margin, and share of voice.
Lead every client report with an executive summary and verdict, then back it up with detail, not the other way around.
A good Amazon agency reporting framework does two things at once: it proves the work is driving profit, not just ad clicks, and it gives your team a repeatable structure so reporting doesn't get rebuilt from scratch for every client.
Below is the framework we'd build for 2026: which data sources to connect, which KPIs actually matter, how often to report on each, and how to lay out the report itself.
Why Ad-Level Reporting Isn't Enough Anymore
Native Amazon reports are siloed by design.
Sales, ads, fees, and refunds each live in their own place, and none of them answer the question a client actually cares about: which SKUs are profitable once everything is accounted for.
Advertising cost of sale (ACoS) alone can look healthy while margin quietly disappears. A 28% ACoS can sit next to a 2026 fee stack that includes referral fees, FBA fulfillment, storage, and inbound placement charges, six or more layers deep, and none of that shows up in the ACoS number itself. A reporting framework built only on ad metrics will always miss this.
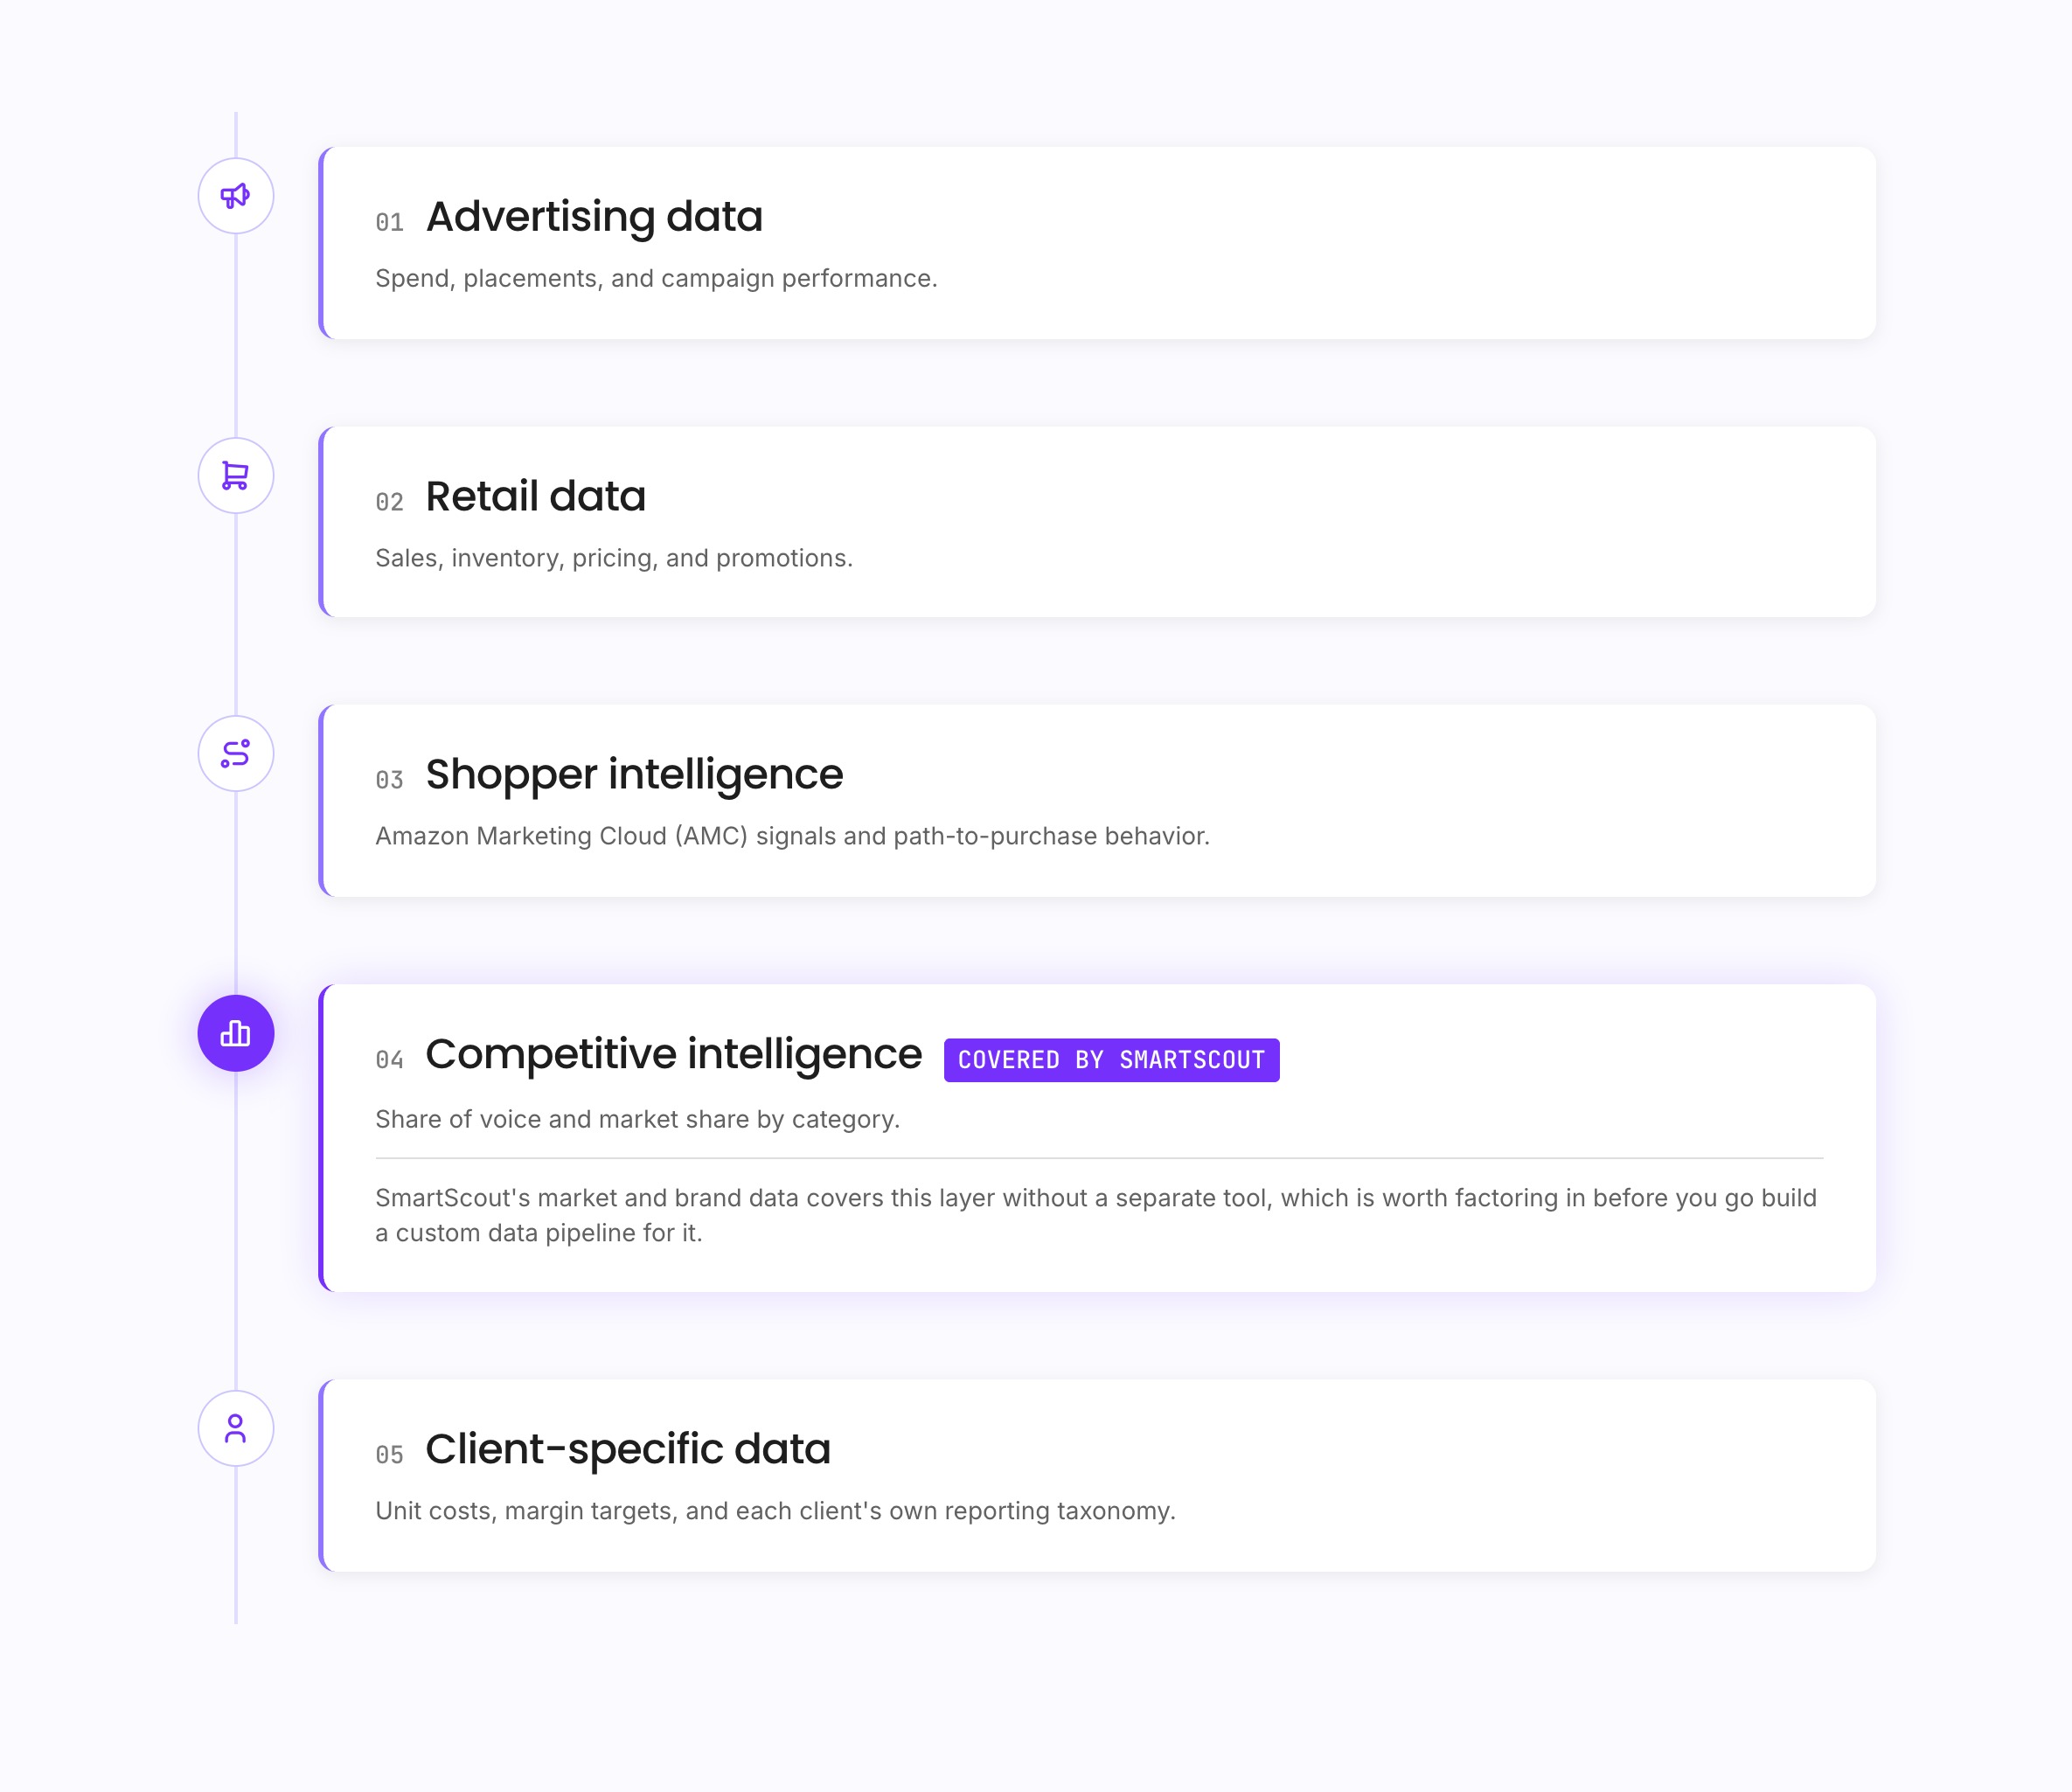
The Five Data Buckets Your Reports Need to Connect
Before picking KPIs, get the underlying data in one place. Agencies scaling reporting in 2026 are converging on five connected data sources:
Reports built on advertising data alone will always look thinner than reports that connect all five. SmartScout's market and brand data covers the competitive intelligence layer without a separate tool, which is worth factoring in before you go build a custom data pipeline for it.
The Core KPIs
Two numbers should anchor every report:
TACoS (Total Advertising Cost of Sale) divides ad spend by total sales, both ad-attributed and organic, so it shows whether the account is growing overall or just shifting where sales come from. A healthy account-level TACoS runs 10 to 15% of total revenue for an established seller. New launches run higher, often 25 to 40% in the first one to three months, before organic rank compounds and the number comes down. Category sets a floor too: electronics tends to sit near 9%, while beauty and supplements run higher at 15 to 17%.
Contribution margin per SKU is the number TACoS can't give you on its own. It's selling price, minus cost of goods (product, freight, and prep), minus the Amazon referral fee, minus FBA fulfillment, minus storage. Two SKUs can carry the same TACoS and have completely different margins once that math runs. Report contribution margin alongside TACoS, not instead of it, so budget conversations are grounded in dollars, not just ratios.
Reporting Cadence
Not every metric needs the same attention. Daily checks catch problems before the client does. Monthly reports tell the growth story.
Amazon Performance Metrics & Cadence
Metric
Cadence
Primary Owner
Why
Buy Box status, stock levels
Daily
Account manager
Catches issues before they cost sales
ACoS by campaign
Weekly
PPC lead
Keeps bid decisions current
TACoS (account-level)
Monthly
Account lead
Shows whether growth is net-new or shifted
Contribution margin per SKU
Monthly
Account lead
Confirms growth is profitable, not just efficient
Share of voice / competitive position
Monthly
Strategy lead
Frames performance against the category
Building the Monthly Client Report
Structure the report so the client sees the verdict before the detail:
Executive summary. TACoS and contribution margin trend, one paragraph, no jargon.
KPI dashboard. The five metrics above, this month against last month and against the category benchmark.
What changed and why. Tie any TACoS or margin shift to a specific cause: a fee change, a stockout, a new competitor, a bid adjustment.
Next month's plan. Two or three specific actions, not a general strategy recap.
Agencies that skip straight to campaign-level detail lose the client's attention before they get to the part that matters. Lead with the verdict, then back it up. If your team is spending most of a reporting cycle exporting and reformatting data by hand, that's usually a sign the underlying tooling needs a second look rather than the framework itself.
Lorem ipsum dolor sit amet, consectetur adipiscing elit, sed do eiusmod tempor incididunt ut labore et dolore magna aliqua. Ut enim ad minim veniam, quis nostrud exercitation ullamco laboris nisi ut aliquip ex ea commodo consequat. Duis aute irure dolor in reprehenderit in voluptate velit esse cillum dolore eu fugiat nulla pariatur.
Lorem ipsum dolor sit amet, consectetur adipiscing elit, sed do eiusmod tempor incididunt ut labore et dolore magna aliqua. Ut enim ad minim veniam, quis nostrud exercitation ullamco laboris nisi ut aliquip ex ea commodo consequat. Duis aute irure dolor in reprehenderit in voluptate velit esse cillum dolore eu fugiat nulla pariatur.
Lorem ipsum dolor sit amet, consectetur adipiscing elit, sed do eiusmod tempor incididunt ut labore et dolore magna aliqua. Ut enim ad minim veniam, quis nostrud exercitation ullamco laboris nisi ut aliquip ex ea commodo consequat. Duis aute irure dolor in reprehenderit in voluptate velit esse cillum dolore eu fugiat nulla pariatur.